ZECBTC trade ideas

ZEC / BTC: Long term thoughts / outlookLong term thoughts on a good privacy coin ZEC, great network update coming today (10/28) and it looks to be accumulating right now. Now saying a 7x will happen here but it has happened before, felt it was notable. The mining hashrate on ZEC also has gone parabolic.


ZEC iH&S breakout? ZEC has been on a tear lately with the listing of ZRX just spurring more excitement in the hopes that it could be next. We could see an inverse head and shoulders diagonally that has played out nicely and broke out yesterday and is currently on its way.
We did run into resistance right way as we can see with that wick straight up to the supply zone but the projection for this pattern gives a target of approx. the upper supply area near 0.0275. Whether it gets there in one shot or gradually really depends on market dynamics but one can assume that a Coinbase listing could help it on its way fairly quickly.
Thanks guys!
ZEC will move down for short-termIn time h6, the divergence between the price and the RSI has appeared
In addition, ZEC met an important resistance in the D1 frame, producing the doji candlestick in both D1 and H6 frames, signaling the price will soon drop to support levels at Pivot.


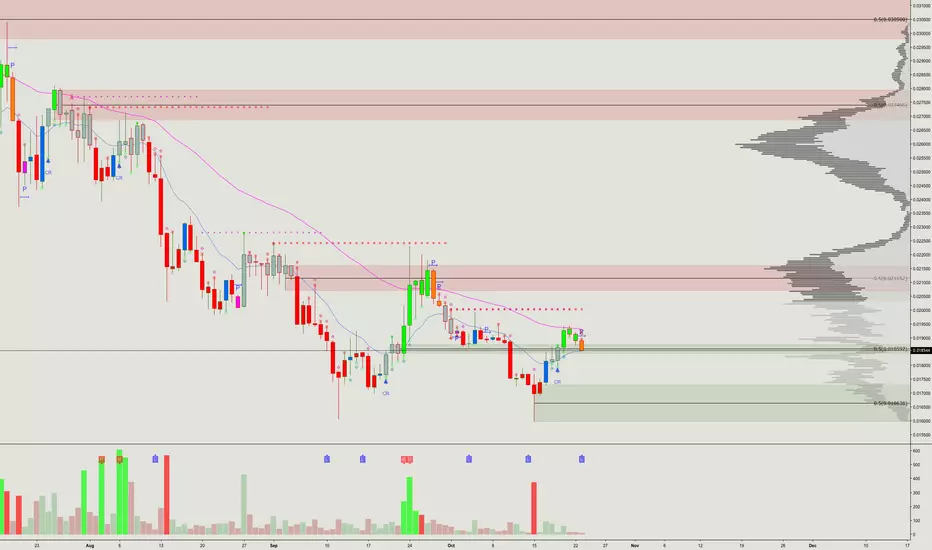
ZEC printing a bearish pivot candle!ZEC moved up nicely off the local bottom but found trouble at the EMA, rejecting and falling back into the demand zone.
A bearish pivot candle has printed so far and if we close this way, we could expect to see further downside, possibly down to the lower demand area before seeing a bounce. Of course, it is still early to jump to conclusions but as we have seen in the past, these pivot candles do lead to some more downside after they close.
Thanks guys!

ZCash [ZEC] Will It Bounce?Two ideas back-to-back, so at least one of them should be right...
Right?
Waiting to see if this bounce depicted on my ZECBTC chart will occur. It would be pretty interesting because up until now, this diagonal line has been respected at multiple points. Actually, it would be more than just interesting, it'd be profitable. ZECBTC will have fallen about 4% from the previous high at that point.
Novice trader, publishing for my records only. Open to critiques by professional traders.

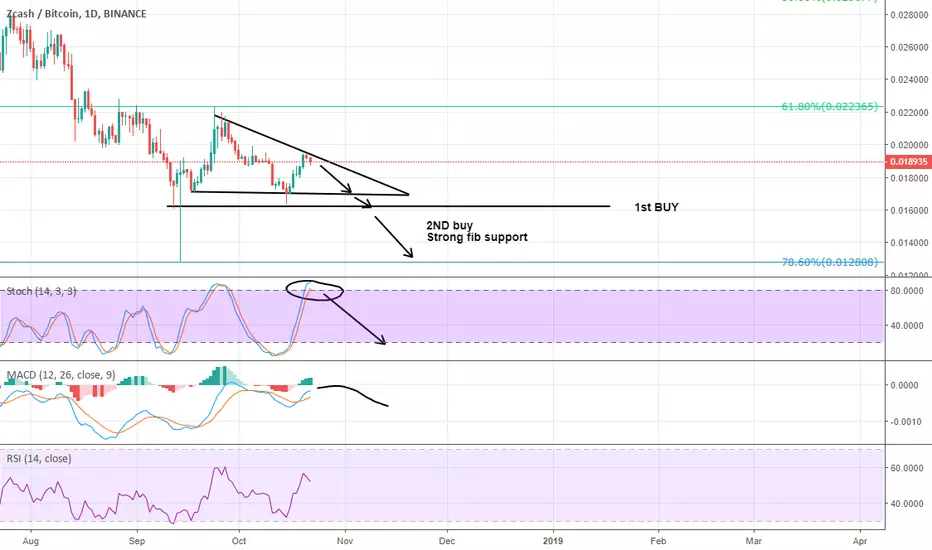
ZEC BTC BEST BUY ENTRY POINTS
Zec against BTC now is situated into a Triangle where:
-Stoch is overbought 89+ and soon will be a bearish divergence here
-MACD it-s still in negative zone,they have room to go up till neutral zone(0) is bearish
-RSI 52 and still droping
Wait for LONG ENTRY:
IF BTC make a breakdown we will have the opportunity to entry long in zec at these supports:
1) 0.016000 sats is a strong 1D support.
2) 0.012000 sats for a nice double bottom ,this is also a fibonaci 78.60% support
IF BTC will going up,we will entry at 0.0169 which is the resistance of triangle
In any case,they will drop
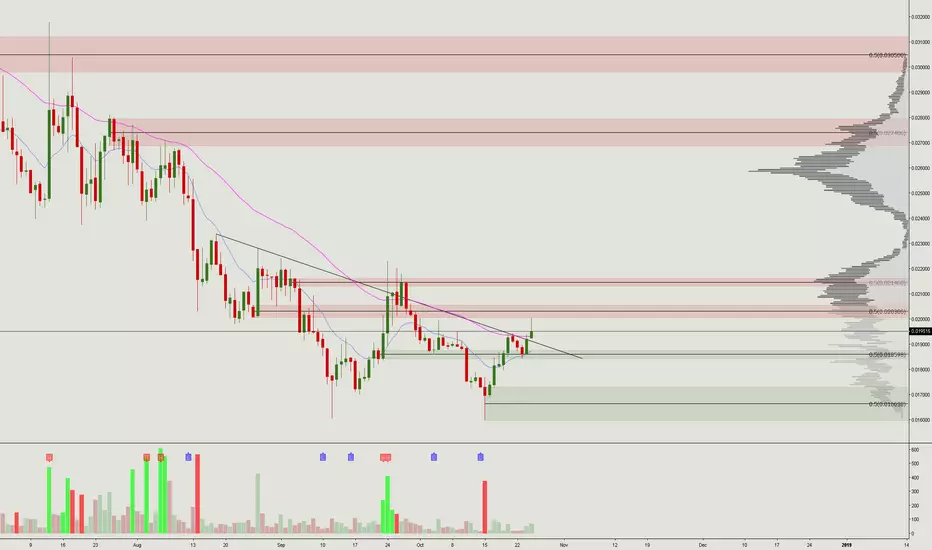
ZEC pivot of doom? ZEC has been on a tear recently after bouncing off the 0.016 level but has hit a brick wall on its way back up to the supply block around 0.0207.
We still have a CR UP printed on the Daily chart BUT an orange pivot candle seems to have appeared today, which as previously shown, could spell some downside for ZEC here. Obviously, we would need the candle to close like this before getting to any conclusions but this is a warning sign.
The fast-moving EMA has curled upwards but the slow-moving still trends slightly down as it remains resistance.
We currently are sitting right on top of the demand zone so as long as we hold here, we could expect that the uptrend will continue especially with the possible Coinbase listing in the near future.
Thanks guys


ZECBTC
Trend line test.
Exiting if parabola stops and will find re-entry later.
Staying in if the trend stays.

zero electric coin company or zcashdouble bounce, broke the descending wedge, on the line up for coinbase listing

ZCASHZECBTC
Short-mid term
See the classic formations :
the double bottom;
small Head & Shoulders.
Have resistance line for this.
ZEC is at the all-time low price now.
So it's good premises to buy.

ZEC-BTC Binance - bearish divergenceChart is self explanatory. ( I don't like ultra cluttered noob charts with every indicator )
On 4 hr chart we can see a higher high on price action but a lower high on RSI aka - bearish divergence
So you can sell your zcash (if you wish :) and buy back at 0.017428 around 6.5% profit.
Stop loss above 200MA.
Remember this is a swing trade so it may take some time and could get affected by BTC volatality.
If you have any questions ask in comments.
Happy Hunting.
Note- This is not a financial advice trade at your own risk.

ZEC/BTCWill immediate support hold or do we need a typical Fib retracement?
Bullish factors: 9 ema above the 20 ema, rsi above 50, macd bullish, cci above 0 so if the 55 ema hold we should see higher highs.
Bearish factors: Under some pretty nasty bearish divergence currently but that would be negated if price breaks higher than the 0.27 Fib extension level.
If 0.017 fails and we continue making lower lows I'll be waiting for new support levels to watch.

ZEC is going to MOON! 100% Potential UpsideBITFINEX:ZECBTC is looking PRIMED for a large expansive move to the upside. After retesting the all-time-low which is confluent with the demand zone, and a capitulatory volume spike, this is about as good as a bottom indicator as I can possibly envision. This combined with a hidden bull divergence on RSI increases my confidence even further.
To add some icing to the cake, Coinbase will most likely be listing ZEC at some point in the foreseeable future. This will be the first privacy-centric coin to be listed, and I expect it to sell like hotcakes.
There will be lots of key resistance levels along the way which will be great opportunities to book some profit.
I will be adding back to this position once it retests the levels, hoping they will then act as support.


Zcash ZECCrazy bullish long term but two major downtrend resistances to look upwards at right now. Looking to start to finish loading the bag on a retest of the rectangle looking something like this... High inflation since it launched in 2016 and the halvening is late 2020 which is also when the founders reward ends. Don't FOMO into these resistences, look for the retest. First privacy coin on Coinbase Q1 2019.

ZEC break of resistance, no confirmation yetLooking for a retest of resistance to hold as support to enter
