ZECBTC trade ideas
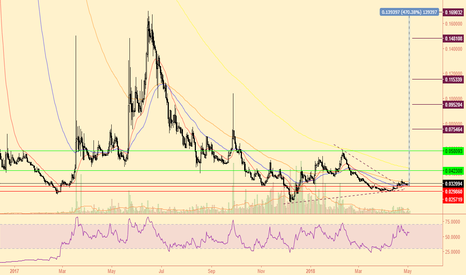
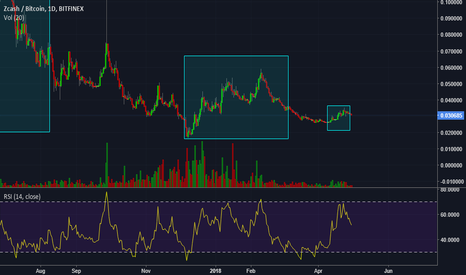
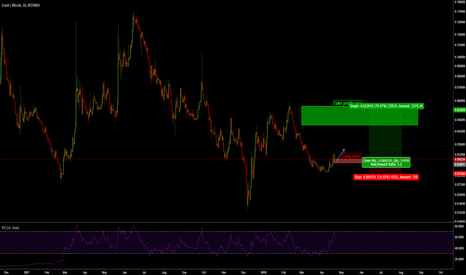
ZEC - ZCash showing a ton of potentialHey folks! Looking at the daily chart for ZEC, I can't help but get excited. Ever since the price of ZEC fell below the pink line in June of last year, it has not been able to break it. I think when it does, it could jump fast. It's also a privacy coin, which is very popular in the crypto world. I'll be keeping my eye on this one for sure!
ZEC - Hey everyone
The D3ADLYTuna is here to poison your minds, so let's look at ZCash.
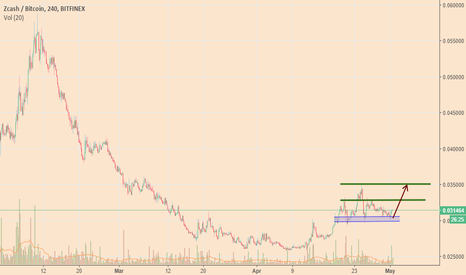
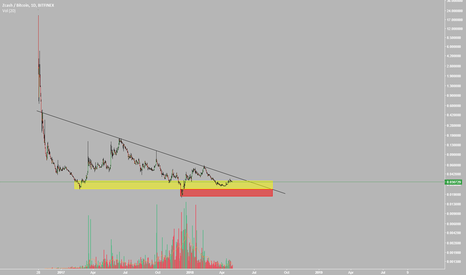
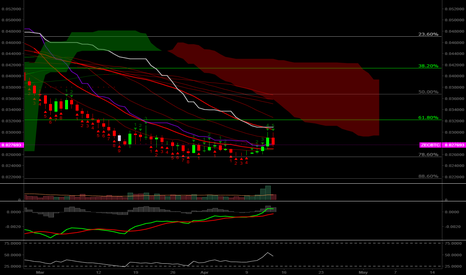
Zec I have been watching for a while now however it has now broken out of the general down trend.
I welcome your comments and feedback.
Technicals:
Volume
Good increase over the last few bars.
MACD
Yes it's pointing down right now but this lines up with the current retracement and we are looking to confirm it turning on the smaller timeframes and sitting at least FLAT on the daily. The reason for this is that I use different settings on my MACD and as a result it is potentially more volatile, but also much faster to give signals than standard crypto settings.
RSI
Now showing a solid uplift from weakness and again will look for the confirmed flatline and turn here in confluence with the 12hr MACD.
Waves
I have not shown the waves here however I have left the Fib lines up as this is showing a great 62% retracement on the first wave as shown on the 4hr fib below.
Fibs
The 4h below shows how the wave has retraced to 62% fib. The daily fib shown here is sitting on another retrace fib line as well.
Trend
Yes the cloud and indicators show a down trend. We can see the moving averages have converged and action is sitting between the 20ma and 50ma - which are the brighter Red/Green lines.
Support
At this point it would appear to be a prime entry level but there are several factors to consider here. BTC has technically broken out of the down trend but has neutral action and indicators are about to hit a decision point so we need to see if there will be a break up or down.
Lastly, the indicators im reading here are set to identify possibilities, not confirmations. This means that price action could completely break down from this point with the market so this is a space to watch closely for confirmed support and enter at your own risk. In saying that, the daily has shown a considerable amount of time and support at the current fib hence I am confident in making this suggestion.
Don't Forget:
-Always use a stop loss.
-Utilise alerts to notify you when you are reaching your target.
-It is common to use no more than 10-20% of capital in any one trade.
-Layer your buys to average your entry cost.
-Always watch BTC as well as your active trades, if BTC breaks down or pumps hard the market will chase it to the detriment of solid trades. FOMO is real.
If you have had success with a trade signal and would like to tip or donate:
ETH 0xA931D6F82e37dC459096D68cD6d8414f79840753
If you are not already signed up on the below exchanges you are welcome to join using the below links:
Binance bit.ly
Cryptopia bit.ly
KuCoin bit.ly
These are the three core sites I use personally depending on the coins I wish to purchase. Primarily I use Binance for the cheap fees and BNB discounts, I am also registered on Bittrex but only use this when necessary due to fees.
Disclaimer:
The information published is not intended to, nor should it be, construed as financial advice. The sole purpose of publication is for educational purposes and feedback. Any investment decisions, gains or losses, are your own and I hold no liability. Invest only what you are prepared to lose.
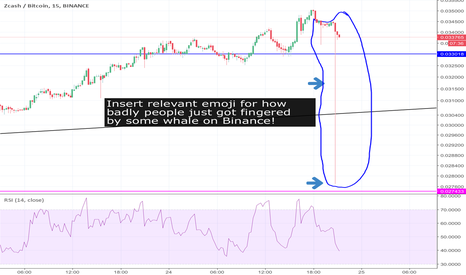
Savage flash crash on ZCash - Binance!? Wow!How do you fancy a 20% flash crash and rebut in about 10 seconds flat.....
These things happen I’m afraid, especially with so many algos and bots on to- of a manipulated market, and that’s an important lesson from me to you.
I never, ever trade on margin in these markets. There’s no need. Really.
And, this is a tricky topic, but I don’t use stops. It’s just too easy to get stopped out in an unfavourable position and then once all the stop hunting is done, massive pump in favour of your original trade. Sound familiar?...
Now what’s the betting that just scared the crap out of a load of people, took out every stop in sight and after this subsides - ZCash rebounds hard! That’s my bet anyway.
Crazy times. Trade safe.
The Colonel
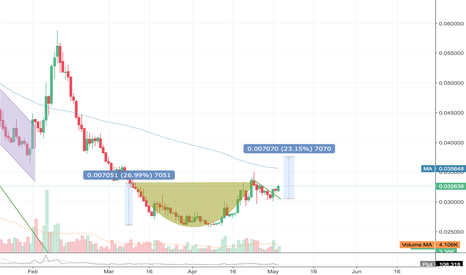
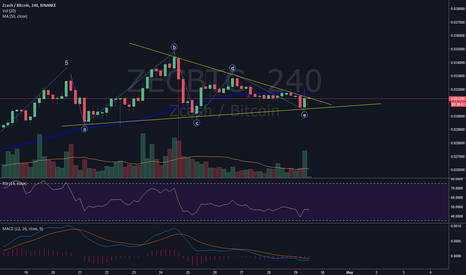
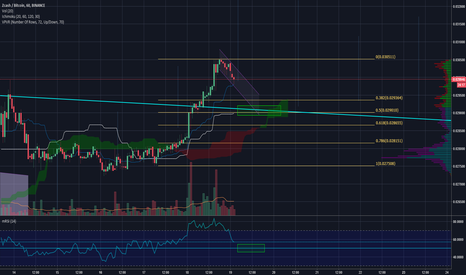
ZEC Correcting a littleZEC retracing to set the momentum for the next leg up. I will certainly add back at .02905:
1) Forming a bit of a cup and handle which has the proper volume profile for it as volume is decreasing on this trip downwards forming the handle.
2) Retrace of last move up and the bottom of cup has a .5 retracement at .02905
3) The light blue line is a long term trend line that is acting as the Adam and Eve break line so a retest of that line and bounce up would be EXTREMELY bullish with a target of around .0334 but ultimately would signal a bullish trend.
4) The Kijun on many time frames is also in this exact .02905 region.
5) RSI will be able to reset its momentum and treat 50 as the support level for a wave up.
Most alts look very similar to this right now after the last week and especially last 2 days. They are retracing and so the next 24 hours is massive for alt season. I would guess a lot also relies on ETH. Will ETH hold its own retracement to around .0645
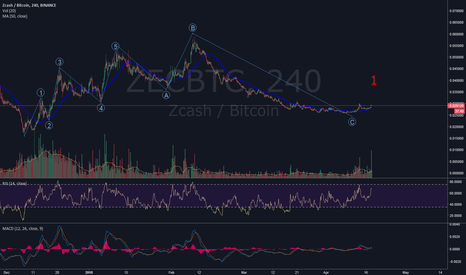
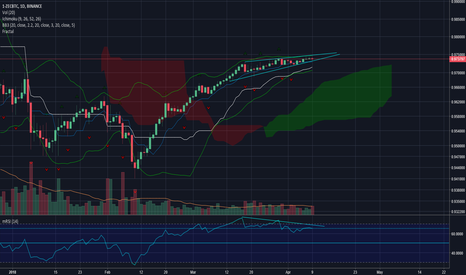
ZECBTC InvertedTHIS IS ZEC INVERTED SO WHAT LOOKS LIKE A REVERSAL FROM A BULL TREND TO A BEAR TREND IS ACTUALLY A POTENTIAL BEAR TREND TO BULL TREND REVERSAL
Not the biggest privacy or ZEC person but this appears to have some great trade setups and looks like a good time to get in
What I see on this chart:
1) First and foremost there is a clear trend upwards and it is stalling drastically over the past 23 candles. Price is above cloud, cloud is green, price is above Kijun and Tenkan is above Kijun. All signalling a strong trend is in tact.
2) The trend is forming a rising wedge which is a good sign of a reversal along with the falling volume
3) Bearish standard divergences have formed as the RSI is making lower highs while price is making higher highs which is another reversal indicator
4) Bollinger Bands are tightening which signals a volatile move is likely to come and we can use the previous bullet points as signals this volatility could lead this chart to the downside (which is actually upwards on the non-inverted chart).
Not financial advice, just my thoughts on what I see happening with ZEC at the moment. I have opened a position and am targeting the Kijun first and will reconfigure at that point. Stop loss is tight
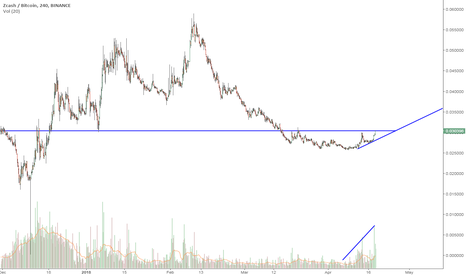
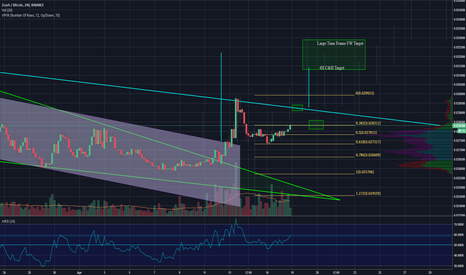
ZEC Forming C&H Out of FWFalling wedge is playing out into a cup and handle pattern. Volume is increasing as well.
I expect to see a test of the neckline with a fall to the overall 0.382 fib level which is around the 0.5 move from the bottom of the cup. The cup fell perfectly to the 0.618 measured fib level from the last leg up and also formed an RSI continuation div. This seems very bullish from here. Ultimately the C&H target is within the same range as the Falling Wedge target around .032.
