ZEC very promising coin with lot of events behind...This is not a financial advice. Always do your own research and always put stoploss in your trade (SL) :) If you want more detailed info how to study and read charts or just need help with some coin, just write to me here personal message, i will try to answer to everybody... i can help you :) all for free, don't worry, BE HAPPY!
If u like the analysis, please feel free to ask any question about this TA or crypto or any coin and also leave a comment or like, i really appreciate it because then my work makes sense :) thanks!
ZECBTC trade ideas

Crypto|ZEC/BTC|LongLong ZEC/BTC
Activation of the transaction only when the blue zone is fixed/broken.
The author recommends the use of anchoring fixed the blue zone, this variation is less risky.
If there is increased volatility in the market and the price is held for more than 2-3 minutes behind the activation zone after the breakdown, then the activation of the idea occurs at the prices behind the activation zone.
The idea is to work out the resistance level .
* Possible closing of a trade before reaching the take/stop zone. The author can close the deal for subjective reasons, this does not completely cancel the idea and is not a call to the same action, you can continue working out the idea according to your data, but without the support of the author.
+ Maybe right now we will go even lower, then it's okay, the idea is not activated and simply canceled.
The "forecast" tool is used for more noticeable display of % (for the place of the usual % scale) of the price change, I do not put the date and time of the transaction, only %.
Blue zones - activation zones.
Green zones - take zones.
The red zone - stop zone.
Working out the stop when the price returns to the level after activation + fixing in the red zone.
Orange arrow - the direction of take.
Black arrow - neutral scenario without activating the trade.
The red arrow - the direction of the stop.
SUM PNL: This parameter displays the total % of all closed ideas of the "new" format (according to the author) for this sector at the time of publication of the idea. The calculation is very "clumsy" just the sum of the profits of all the ideas, based on this indicator, you can more accurately assess the risks when working with my ideas of this sector. I present you the construction of the idea, you can use it yourself as you like based on your subjective view and risks, the calculation of the PNL indicator is carried out only on transactions that the author closed on TV in manual mode or by take.
P.S Please use RM (risk management) and MM (money management) if you decide to use my ideas, there will always be unprofitable ideas, this will definitely happen, the goal of the system is that there will be more profitable ideas at a distance.


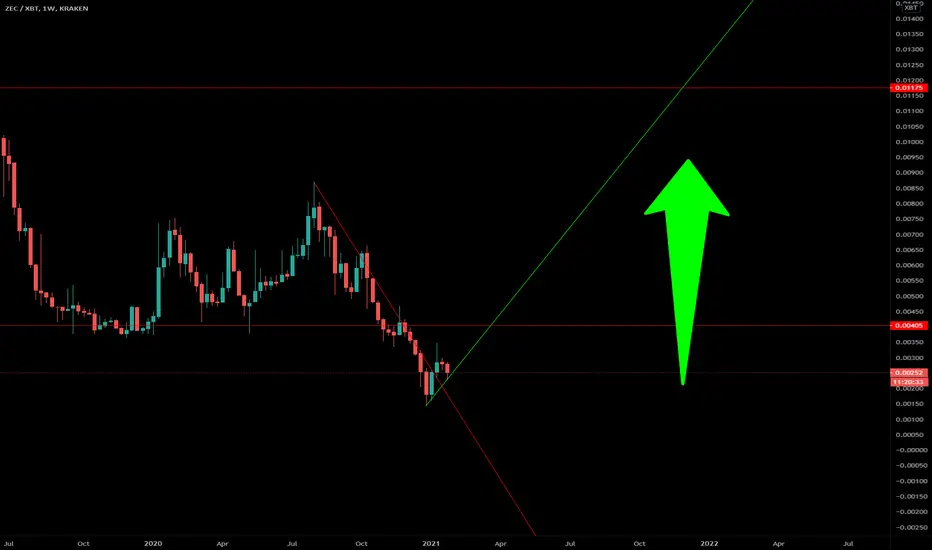
ZECBTC long ideaafter making last two years ATH ZEC quickly dropped to the 0,00230 level area with the BTC falling down from 58K and accumulating around 0.0026x satoshi. According to the daily trendline its still bullish and has to recover the loses and first target is 0,0037x satoshi level.

Bullish on ZCashA double bottom is formed following a single rounding bottom pattern which can be the first sign of a potential reversal. Rounding bottom patterns will typically occur at the end of an extended bearish trend.


Z-Cash Pump - targetsThe Z-Cash pump seems to have stalled out ut make no mistake - all the technicals are stiill in place for a continuatiion of this pump. I have my chart showing me a potential target of 0.005110 within 12 hours. Fingers crossed!

#tradeWithmky ZEC bullish movement ?!hello everyone
in this analysis I though zEC can pass the downTrend and turns to uptrend
there are some logical tips here That i Try to mention
First of all if price make a high upper than last lower high we can count as bullish market or you can wait for pull back to enter to a trade
something that is really important here is ichimoku in indicators
Price is above ichimoku cloud and cloud turns to green
as you can see here
also there are some more tips I will publish later so be in touch
#TradeWithMky

💡 Don't miss the great buy opportunity in Zcash/BitcoinTrading suggestion:
. There is a possibility of temporary retracement to suggested support line (0.00275). if so, traders can set orders based on Price Action and expect to reach short-term targets.
Technical analysis:
. Zcash/Bitcoin ZECBTC is in a range bound and the beginning of uptrend is expected.
.The price is above the 21-Day WEMA which acts as a dynamic support.
. The RSI is at 70.
Take Profits:
TP1= @ 0.00430
TP2= @ 0.00490
TP3= @ 0.00560
TP4= @ 0.00660
TP5= @ 0.00750
TP6= @ 0.00870
SL= Break below S2
❤️ If you find this helpful and want more FREE forecasts in TradingView
. . . . . Please show your support back,
. . . . . . . . Hit the 👍 LIKE button,
. . . . . . . . . . . Drop some feedback below in the comment!
❤️ Your Support is very much 🙏 appreciated! ❤️
💎 Want us to help you become a better Forex trader ?
Now, It's your turn !
Be sure to leave a comment let us know how do you see this opportunity and forecast.
Trade well, ❤️
ForecastCity English Support Team ❤️

ZEC POTENTIAL ZEC coming up to trendline resistance, looks like there is massive potentital to the upside.


Z-Cash - It is TimeZ-Cash is breaking out. The hidden monster is on the rise and soon people will look back at this token and wonder how they missed it the whole time: Digital gold. The real thing, not one full of history and public scrutiny. Privacy isn't just for people. It's for corporations and nation-states and it's a prized commodity - if you are someone with actual power in the world. The rest of us are made to think it somehow suspicious. Why? That's the programming talking and it's working.
Anyways, see the chart, Z-cash is about to shock everyone as it makes its way to $400, then $1k+. Those of us who see this coming will be glad we got some Z

Fibonacci at WorkPhi is everywhere and here is yet another example of how this amazing ration plays out on our markets - and in every arena where life is manifest. In other news, ZEC is taking over. That is all.

Crypto|ZEC/BTC|LongLong ZEC/BTC
Activation of the transaction only when the blue zone is fixed/broken.
The idea is to work out the resistance level .
* Possible closing of a trade before reaching the take/stop zone. The author can close the deal for subjective reasons, this does not completely cancel the idea and is not a call to the same action, you can continue working out the idea according to your data, but without the support of the author.
+ Maybe right now we will go even lower, then it's okay, the idea is not activated and simply canceled.
The "forecast" tool is used for more noticeable display of % (for the place of the usual % scale) of the price change, I do not put the date and time of the transaction, only %.
Blue zones - activation zones.
Green zones - take zones.
The red zone - stop zone.
Working out the stop when the price returns to the level after activation + fixing in the red zone.
Orange arrow - the direction of take.
Blue arrow - neutral scenario without activating the trade.
The red arrow - the direction of the stop.
SUM PNL: This parameter displays the total % of all closed ideas of the "new" format (according to the author) for this sector at the time of publication of the idea. The calculation is very "clumsy" just the sum of the profits of all the ideas, based on this indicator, you can more accurately assess the risks when working with my ideas of this sector. I present you the construction of the idea, you can use it yourself as you like based on your subjective view and risks, the calculation of the PNL indicator is carried out only on transactions that the author closed on TV in manual mode or by take.
P.S Please use RM (risk management) and MM (money management) if you decide to use my ideas, there will always be unprofitable ideas, this will definitely happen, the goal of the system is that there will be more profitable ideas at a distance.


