
ZEC: The Binance Drama#Zcash withdrawals on the ZEC network have been suspended on Binance for weeks, raising concerns especially with also it being in their monitoring list.
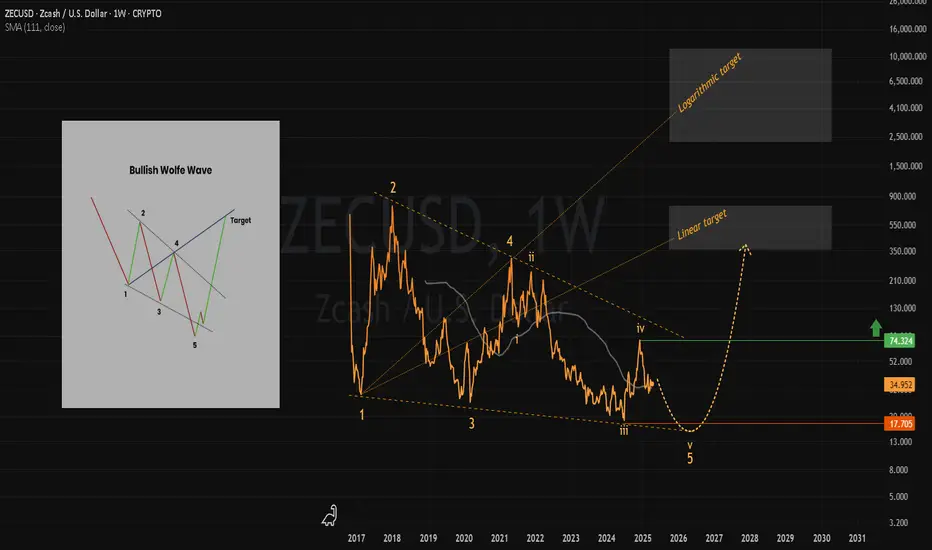
Technically, ZEC remains weak below $74.4. A drop below $17.7 to a new ATL could come before a major bullish reversal.
ZECUSD break for support ? Retesting ZECUSD was trending in uptrend and broke the support and it become its resistance. expecting to reach 30. let us see.

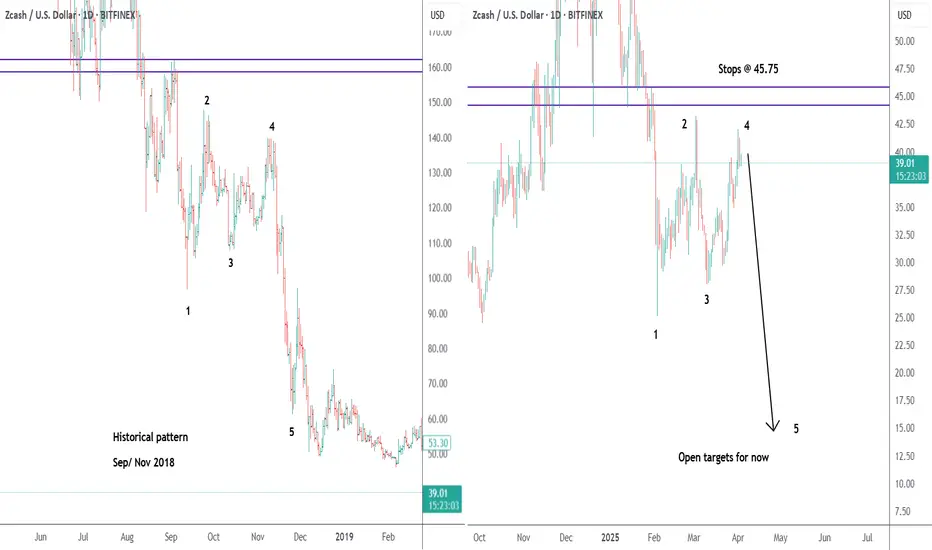
ZEC ShortA historical pattern from Sep/ Nov 2018 might be repeating in real time.
Next update in 1 to 2 weeks.
Falling Wedge Pattern For ZCash??When a security's price has been falling over time, a wedge pattern can occur just as the trend makes its final downward move.
The trend lines drawn above the highs and below the lows on the price chart pattern can converge as the price slide loses momentum and buyers step in to slow the rate of d

Zcash Monthly RSI Divergence This RSI Divergence is huge..
There is also a Lower Highs and Lower Lows + Diminishing Volume
i dont know what it means
but i am in

ZCASH Stock Chart Fibonacci Analysys 030825Trading Idea
1) Find a FIBO slingshot
2) Check FIBO 61.80% level
3) Entry Point > 34/61.80%
Chart time frame: B
A) 15 min(1W-3M)
B) 1 hr(3M-6M)
C) 4 hr(6M-1year)
D) 1 day(1-3years)
Stock progress: A
A) Keep rising over 61.80% resistance
B) 61.80% resistance
C) 61.80% support
D) Hit the bottom
E)

Ascending Triangle pattern for Zcash or Hidden Bear Flag!!!??!?!It appears as though Zcash is forming an ascending triangle pattern, but often this can be confused with a bear flag depending on the Macro Trend of the asset.
The rsi is in a great place for the price to pump.
We have seen the price of Zcash touch the upward sloping support of the pattern over ha

ZEC Weekly & Monthly Chart Will Print God Candles Ironically Zcash is $36 at the time of writing this or 666.
The number of the flesh
Flesh
The need for money
Kill your ego and starve your pride but still need money to survive
Zcash is the stash
The stash to melt faces
One of many Phoenix that will arise from our debt laden and dying o

Super Squeeze On Zcash Monthly I’ve believed a lot in zcash over the years. Held the top and did other things. Looking at the chart again Im thinking it’s time to buy some more. This project has always seemed like a long term company in my opinion and I’ve always looked at it like a real competitor to Bitcoin. The price has b

See all ideas
Curated watchlists where ZECPERP is featured.

Gen 2: Crypto is here to stay - and it's brought some friends…
19 No. of Symbols

Privacy crypto coins: private or fraudulent?
11 No. of Symbols

Proof of Work: Embracing the crunch
27 No. of Symbols

Top altcoins: Choose your alternatives carefully
28 No. of Symbols
See all sparks