ZECUSD D2: 1000% gains BEST LEVEL TO BUY/HOLD(SL/TP)(NEW)Why get subbed to me on Tradingview?
-TOP author on TradingView
-2000+ ideas published
-15+ years experience in markets
-Professional chart break downs
-Supply/Demand Zones
-TD9 counts / combo review
-Key S/R levels
-No junk on my charts
-Frequent updates
-Covering FX/crypto/US stocks
-before/after analysis
-24/7 uptime so constant updates
🎁Please hit the like button and
🎁Leave a comment to support our team!
ZECUSD D2: 1000% gains BEST LEVEL TO BUY/HOLD(SL/TP)(NEW)
IMPORTANT NOTE: speculative setup. do your own
due dill. use STOP LOSS. don't overleverage.
READ ENTIRE IDEA BEFORE EXECUTING.
🔸 Summary and potential trade setup
::: ZECUSD 2days/candle chart review
::: updated outlook still valid today
::: end of 2021 PT BULLS 750 USD
::: 800-1000% UPSIDE BUY LOW
::: CORRECTION MODE next 2-4 weeks
::: overall strong chart/ V-shape recovery
::: chart is LOG SCALE
::: get ready to BUY LOW later
::: BUY LOW near end of August 2021
::: entry - after CORRECTION
::: up to 1000% gains possible later
::: short-term pullback/correction
::: correction/pullback NOW
::: however chart looks strong
::: SPECULATIVE SETUP
::: do your own due dill
::: and use proper risk management
::: TP bulls is +1000% gains
::: details: see chart
::: FINAL TP is 1000% gains
::: recommended strategy: BUY/HOLD after pullback
::: TP BULLS +1000% gains
::: SWING TRADE: BUY/HOLD IT
::: bull run not over yet
::: good luck traders!
::: BUY/HOLD and get paid. period.
🔸 Supply/Demand Zones
::: N/A
::: N/A
🔸 Other noteworthy technicals/fundies
::: TD9 /Combo update: N/A
::: Sentiment mid-term: BEARS/CORRECTION
::: Sentiment short-term: PULLBACK/CORRECTION NOW
RISK DISCLAIMER:
Trading Crypto, Futures , Forex, CFDs and Stocks involves a risk of loss.
Please consider carefully if such trading is appropriate for you.
Past performance is not indicative of future results.
Always limit your leverage and use tight stop loss.
ZECUSD trade ideas

ZECZEC is trading above the support zone of $103. If it can stay above this support, we could start seeing a move towards $130, $160 and $201. This move may be expected in a short time frame. Failure to hold the support at $103 could lead to a drop towards $84 and $71 which would be good areas to add ZEC for long term spot bags.

Cryptocurrency Zcash Buy Signals On W1 timeframe.Zcash (ZEC),W1: Support line + Mirror level + Hammer + Hidden divergence

Zcash (ZEC) - July 27Hello?
Welcome, traders.
By "following", you can always get new information quickly.
Please also click "Like".
Have a nice day.
-------------------------------------
(ZECUSD 1W Chart)
If the price holds above the 102.42 point, we expect the uptrend to continue.
(1D chart)
It remains to be seen if the 98.50-123.08 zone can support and move up.
If the price holds above the 123.08 point, it is expected to turn into an uptrend and move higher.
If it falls from the 98.50 point, there is a possibility of entering the mid- to long-term investment zone, so you need to trade cautiously.
-------------------------------------
(ZECBTC 1W chart)
It remains to be seen if it can move above the 0.004650-0.005954 section to continue the uptrend.
(1D chart)
Touch the 0.002058-0.002525 segment and watch to see if it can climb above the 0.002964 point.
------------------------------------------
We recommend that you trade with your average unit price.
This is because, if the price is below your average unit price, whether it is in an uptrend or in a downtrend, there is a high possibility that you will not be able to get a big profit due to psychological burden.
The center of all trading starts with the average unit price at which you start trading.
If you ignore this, you may be trading in the wrong direction.
Therefore, it is important to find a way to lower the average unit price and adjust the proportion of the investment, ultimately allowing the funds corresponding to the profits to regenerate themselves.
------------------------------------------------------------ -------------------------------------------
** All indicators are lagging indicators.
Therefore, it is important to be aware that the indicator moves accordingly with the movement of price and volume.
However, for the sake of convenience, we are talking in reverse for the interpretation of the indicator.
** The wRSI_SR indicator is an indicator created by adding settings and options to the existing Stochastic RSI indicator.
Therefore, the interpretation is the same as the traditional Stochastic RSI indicator. (K, D line -> R, S line)
** The OBV indicator was re-created by applying a formula to the DepthHouse Trading indicator, an indicator disclosed by oh92. (Thanks for this.)
** See support, resistance, and abbreviation points.
** Support or resistance is based on the closing price of the 1D chart.
** All descriptions are for reference only and do not guarantee a profit or loss in investment.
Explanation of abbreviations displayed in the chart
R: A point or section of resistance that requires a response to preserve profits.
S-L: Stop Loss point or section
S: A point or section where you can buy to make a profit as a support point or section.
(Short-term Stop Loss can be said to be a point where profit and loss can be preserved or additional entry can be made through split trading. It is a short-term investment perspective.)
GAP refers to the difference in prices that occurred when the stock market, CME, and BAKKT exchanges were closed because they are not traded 24 hours a day.
G1 : Closing price when closed
G2: Opening price
(Example) Gap (G1-G2)

ZECUSD Cup and HandleA cup and handle idea
Price is currently retracing into the cup
Right now is a good entry for this scenario


ZEC/USD ($80-$100 Strong Support?)💎Technical Analysis Summary💎
ZEC/USD
-After topping out near the 400 dollar level
-ZEC is back to the average or key area of interest
-The 80 dollar lower range of support is coinciding with the 100W Moving Average
-Which has been respected multiple times since August 2020 and up until January 2021
-If this green area of buying interests consolidates and form a base of support
-I think ZEC has the chance to retest its recent swing top near $400
-This is a long shot so It will take few months to get there
-We can Not 100% predict the future price action but only manages our risk
-If ZEC closes below $80 and unable to reclaim above it
-That would be a different scenario and would assume the bears are still in control
-So please, do not forget to follow your trading plan and exit if it goes wrong
⚠️Please always read the description⚠️
Thanks for donating 💰 via Tradingview coins bitcoinpam 🙏🎉
``````````````````````````````````````````````
If you need help🙋 don't hesitate to
Send me a message here PolarHusk 😊
``````````````````````````````````````````````
Trading Involves High Risk ⚠️
Not Financial Advice 💸
Exercise Proper Risk Management 💱
``````````````````````````````````````````````

ZCASH optimistic scenarioOptimistic scenario a channel is formed by a large up move
Of course this up move bars pattern is copied from the previous bull move, the only really comparable price action that we are likely to see
three green circles can be viewed as "three up" move
Not a fan of ZCASH but this TA suggests potential.. If you base your buys on TA.

Zcash (ZEC) - July 5Hello?
Welcome, traders.
By "following", you can always get new information quickly.
Please also click "Like".
Have a good day.
-------------------------------------
(ZECUSD 1W Chart)
If the price holds above the 102.42 point, we expect the uptrend to continue.
(1D chart)
If the price is maintained in the 123.08-172.24 range, it is expected to turn into an uptrend.
If it goes down, you should check to see if it finds support in the 98.50-123.08 zone.
If it falls from the 98.50 point, there is a possibility of entering the mid- to long-term investment zone, so you need to trade cautiously.
-------------------------------------
(ZECBTC 1W chart)
If it rises from the 0.002058-0.008700 sideways section and rises to the 0.008700-0.016096 sideways section, it is expected to create a new wave.
(1D chart)
If the price holds in the range of 0.003169-0.003909, it is expected to turn into an uptrend.
In particular, you should watch to see if it is moving along an upward trend line.
If it goes down, you should check to see if it finds support at the 0.002799-0.003169 level.
------------------------------------------
We recommend that you trade with your average unit price.
This is because, if the price is below your average unit price, whether it is in an uptrend or in a downtrend, there is a high possibility that you will not be able to get a big profit due to psychological burden.
The center of all trading starts with the average unit price at which you start trading.
If you ignore this, you may be trading in the wrong direction.
Therefore, it is important to find a way to lower the average unit price and adjust the proportion of the investment, ultimately allowing the funds corresponding to the profits to regenerate themselves.
------------------------------------------------------------ -----------------------------------------------------
** All indicators are lagging indicators.
Therefore, it is important to be aware that the indicator moves accordingly with the movement of price and volume.
However, for the sake of convenience, we are talking in reverse for the interpretation of the indicator.
** The wRSI_SR indicator is an indicator created by adding settings and options to the existing Stochastic RSI indicator.
Therefore, the interpretation is the same as the traditional Stochastic RSI indicator. (K, D line -> R, S line)
** The OBV indicator was re-created by applying a formula to the DepthHouse Trading indicator, an indicator disclosed by oh92. (Thanks for this.)
** See support, resistance, and abbreviation points.
** Support or resistance is based on the closing price of the 1D chart.
** All descriptions are for reference only and do not guarantee a profit or loss in investment.
Abbreviations shown in charts
R: A point or section of resistance that requires a response to preserve profits.
S-L: Stop Loss point or section
S: A point or section where you can buy to make a profit as a support point or section.
(Short-term Stop Loss can be said to be a point where profit and loss can be preserved or additional entry can be made through split trading. It is a short-term investment perspective.)
GAP refers to the difference in prices that occurred when the stock market, CME, and BAKKT exchanges were closed because they are not traded 24 hours a day.
G1 : Closing price when closed
G2: Opening price
(Example) Gap (G1-G2)


Double bottom at $30 for ZCash. 2-6 months.Im currently biased towards BTC testing $2k to mid 2k's so ZCash seems likely to double bottom around $30-40 (also the ATH for BTC in 2011). ZCash will then have target prices of $900 (neckline) and $3k if double bottom forms. if $1k is breached quickly, we could see $5k-10k Zcash during next bull run.

Potential altcoin will pump in the near future!...(*)My upcoming trading plan will be the top coin under 100.
=)These will be potential coins with good returns in about 2 months(^-*).
(*)Please wait for the backtest of the wedge edge of Bit this time (34-36k) and you know what to buy!...
.GOOD LUCK TRADING FOR EVERYYONE.
+Vietsub:
-Kê Hoach giao dich săp tơi cua minh se là nhưng đông coin top dươi 100.
=)Đây se la nhưng đông coin tiêm năng va sinh lơi tôt trong khoang 2 thang nưa.
-Ae hay chơ đơi khi Bit test lai canh nêm(quanh vung 34-36k) va mua nhưng đông coin ma ae cho la tiêm năng trong đơt tăng gia điên cuông săp tơi đây!...
.CHÚC AE GIAO DICH THANH CÔNG VA NHIÊU LƠI NHUÂN.

Zcash (ZEC) - June 16Hello?
Welcome, traders.
By "following", you can always get new information quickly.
Please also click "Like".
Have a good day.
-------------------------------------
(ZECUSD 1W Chart)
If the price holds above the 111.66 point, it is expected that the uptrend will continue.
It is expected to rise above the 239.40 point and create a new wave.
However, it must break out of the downtrend line to create a new wave.
(1D chart)
We need to see if we can move above the 172.24 point by moving up along the uptrend line.
If it goes down, we should see support at the 98.50-123.08 zone and see if it moves along the uptrend line.
The 123.08-172.24 section is an important sideways section, and if it finds support in this section, it is expected to turn into an uptrend.
If it rises to the 221.39-248.97 section, it is expected to re-determine the direction of the trend.
If it doesn't deviate from the downtrend line (2), it's not likely to lead to a big upside and will likely go down, so be prepared for it.
-------------------------------------
(ZECBTC 1W chart)
It must rise above 0.011389 point to create a new wave.
If it rises from the 0.002208-0.007163 section that forms the boxed section, it is expected to create a bullish wave.
(1D chart)
In order to turn into an uptrend, it needs to rise above the 0.003909 point and find support.
We need to see if we can move up along the uptrend line.
------------------------------------------
We recommend that you trade with your average unit price.
This is because, if the price is below your average unit price, whether it is in an uptrend or in a downtrend, there is a high possibility that you will not be able to get a big profit due to psychological burden.
The center of all trading starts with the average unit price at which you start trading.
If you ignore this, you may be trading in the wrong direction.
Therefore, it is important to find a way to lower the average unit price and adjust the proportion of the investment, ultimately allowing the funds corresponding to the profits to regenerate themselves.
------------------------------------------------------------ -----------------------------------------------------
** All indicators are lagging indicators.
Therefore, it is important to be aware that the indicator moves accordingly with the movement of price and volume.
However, for the sake of convenience, we are talking in reverse for the interpretation of the indicator.
** The wRSI_SR indicator is an indicator created by adding settings and options to the existing Stochastic RSI indicator.
Therefore, the interpretation is the same as the traditional Stochastic RSI indicator. (K, D line -> R, S line)
** The OBV indicator was re-created by applying a formula to the DepthHouse Trading indicator, an indicator disclosed by oh92. (Thanks for this.)
** See support, resistance, and abbreviation points.
** Support or resistance is based on the closing price of the 1D chart.
** All descriptions are for reference only and do not guarantee a profit or loss in investment.
Explanation of abbreviations displayed in the chart
R: A point or section of resistance that requires a response to preserve profits.
S-L : Stop Loss point or section
S: A point or section where you can buy to make a profit as a support point or section.
(Short-term Stop Loss can be said to be a point where profit and loss can be preserved or additional entry can be made through split trading. It is a short-term investment perspective.)
GAP refers to the difference in prices that occurred when the stock market, CME, and BAKKT exchanges were closed because they are not traded 24 hours a day.
G1 : Closing price when closed
G2: Opening price
(Example) Gap (G1-G2)

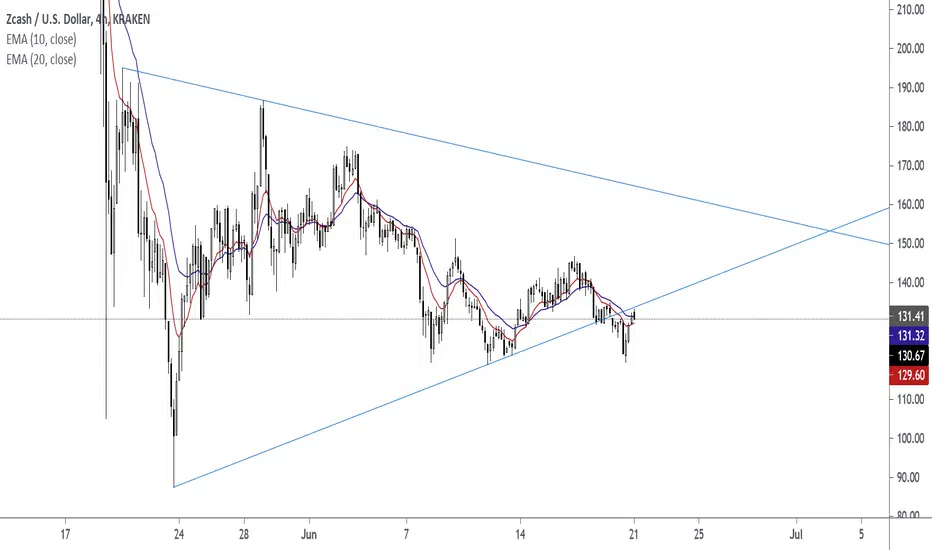
ZEC/USD updateI've updated blue trend lines, orange trend lines and black trend lines
Follow the trend


$DGB OUTPACING $ZECdigibyte outperforming zcash on a few metrics
upside moves have brought in larger gains
digibyte already beating the previous bull run high
both are going to do very well in a continuation of the bull market
not financial advice
