IS ZECUSD READY FOR ITS NEXT BULL RUN? #BLESSEDPIPSWITH A STRONG HOLD AT SUPPORT AND A LOT OF POSITIVE CRYPTO NEWS THIS WEEKEND. THINGS ARE LOOKING POSITIVE, LETS SEE WHAT HAPPENS.
#BLESSEDPIPS
ZECUSD trade ideas

Dropping a bit more before rocket Divergence spotted on the one hour chart on momentum, stochastic, and rsi

ZEC short term shortWhales aren't done with the shake off, market will dump with btc pullback to 30k


Zcash (ZEC) - May 30Hello?
Welcome, traders.
By "following", you can always get new information quickly.
Please also click "Like".
Have a good day.
-------------------------------------
(ZECUSD 1W Chart)
(1D chart)
You should watch for any movement out of the 141.54-180.46 section.
If it rises above the 180.46 point and finds support, it is expected to lead to an uptrend.
In particular, you should watch to see if it moves along the uptrend line (1).
If it goes down, you should check to see if it finds support at the 128.56-141.54 zone.
If it goes down from 128.56, you can touch the 81.37 3 point, so you need to trade cautiously.
--------------------------------------
(ZECBTC 1W chart)
(1D chart)
We'll have to wait and see if there's any movement out of the 3921 Satoshi-4665 Satoshi section.
If it rises above the 4665 Satoshi point and finds support, it is expected to lead to an uptrend.
If it goes down, we need to see if it finds support in the 3673 Satoshi-3921 Satoshi section.
If it falls from the 3673 Satoshi point, Stop Loss is required to preserve profit and loss.
However, it may follow an uptrend line, so you need to trade cautiously.
--------------------------------------
We recommend that you trade with your average unit price.
This is because if the price is below your average unit price whether the price trend is in an uptrend or in a downtrend, there is a high possibility that you will not be able to get a big profit due to the psychological burden.
The center of all trading starts with the average unit price at which you start trading.
If you ignore this, you may be trading in the wrong direction.
Therefore, it is important to find a way to lower the average unit price and adjust the proportion of the investment, so that the funds that are ultimately profit can be regenerated.
------------------------------------------------------------ -----------------------------------------------------
** All indicators are lagging indicators.
Therefore, it is important to be aware that the indicator moves accordingly with the movement of price and volume.
However, for the sake of convenience, we are talking in reverse for the interpretation of indicators.
** The wRSI_SR indicator is an indicator created by adding settings and options to the existing Stochastic RSI indicator.
Therefore, the interpretation is the same as the traditional Stochastic RSI indicator. (K, D line -> R, S line)
** The OBV indicator was re-created by applying a formula to the DepthHouse Trading indicator, an indicator disclosed by oh92. (Thanks for this.)
** See support, resistance, and abbreviation points.
** Support or resistance is based on the closing price of the 1D chart.
** All descriptions are for reference only and do not guarantee a profit or loss in investment.
Explanation of abbreviations displayed on the chart
R: A point or section of resistance that requires a response to preserve profits.
S-L: Stop Loss point or section
S: A point or section where you can buy to make a profit as a support point or section.
(Short-term Stop Loss can be said to be a point where profit and loss can be preserved or additional entry can be made through split trading. It is a short-term investment perspective.)
GAP refers to the difference in prices that occurred when the stock market, CME, and BAKKT exchanges were closed because they are not traded 24 hours a day.
G1 : Closing price when closed
G2: Opening price
(Example) Gap (G1-G2)

Zcash Long... After the massive drop off from nearly $800 back in January of 2018 price has struggle to break out. This has been a POI (point of interest) for quite some time now and a level that I would like to not only see get retested but surpassed.
Now that price has pullback again before the BOS (break of structure) above $800 price action show that now would be a great time to start looking for a good level of supply. This is a chart that was scaled on the 2H, If you has the opportunity do a full top down analysis and you will see the from the weekly rage price has already mitigated off of the 88% fib. For composite operators this is like, "Black Friday" shopping levels.
What I am really waiting for is these equal lows to be taken out sitting at $130 and for the BC (bankers candle) that was formed on the 23rd of May to be mitigated and reject off this level for my pin point entry. PEW PEW
USE PROPER RISK MANAGEMENT

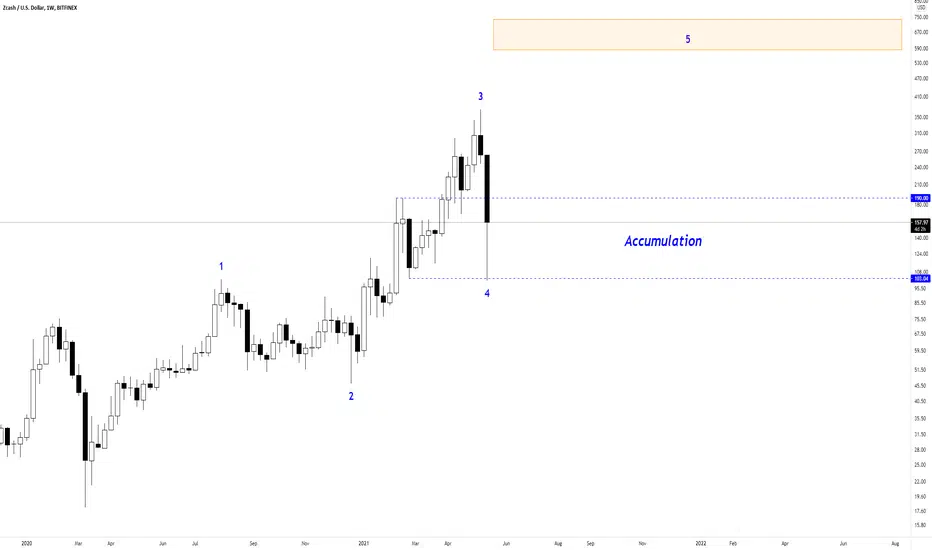
Gradually, then suddenly. Use the dips to accumulate. This is just the warmup. When ZEC is ready for the big show, it will melt faces.


$ZEC - To wait or to Act?$ZEC
Before dropping hard like most altcoins, #ZCASH price was drawing a Rising Wedge pattern - target at blue zone.
However, this went far more down & hit an accumulation zone, and bounced on the 200D MA, but rejected today by 100D MA.
Waiting for more confirmations.

Zek it to meFantasia target 510 , you can do it , i am not your father , this is not financial advice .

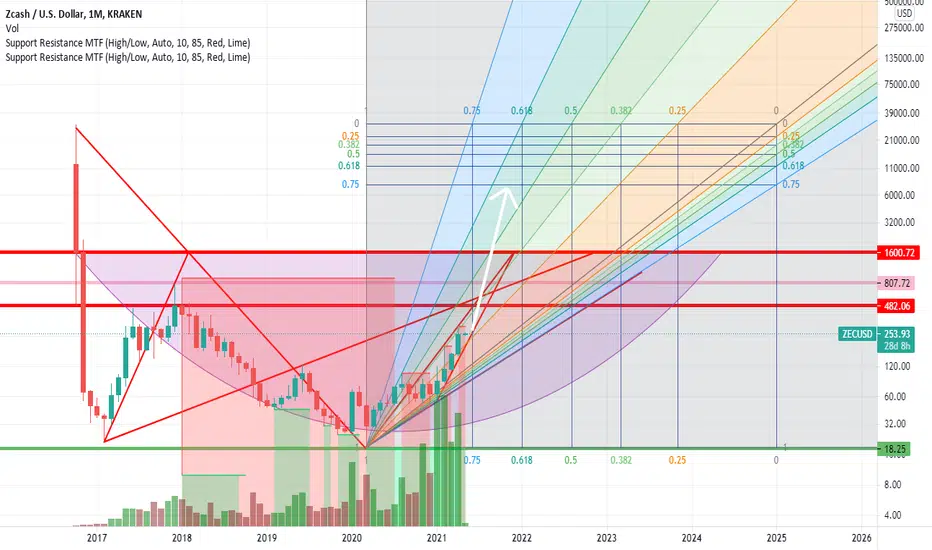
ZCASH Big Picture Logarithmic GrowthTopological-Geometric Intuition. Structural Growth Trend in place. New All Time Highs feel relatively close. Massively elongated top in store. We are only in wave 1 of 4 by my estimation. Hodl for another ~36-48 months from here and it could get absolutely crazy after the next halving and by 2025 we could be looking at $10k+ per coin as *support*. ZCash will be an absolutely fat cash cow the more hedge funds and venture/investment capital flight in crypto takes place. I bet big banks like JPMorgan and UBS will eventually just say F*** it and in order to survive they embrace the privacy aspect that ZCash will offer on an institutional level to their higher end client portfolios. I could see this do-or-die adoption leading to a sustained pump into 5 figures per coin territory since it has the same fixed cap as BTC. This puts ZCash as a premier privacy coin that will eventually dominate other competitors due to its relatively low supply and semi-decentralization. Dash could follow a similar pattern but somehow I think ZCash is the more appealing because it doesn't require the masternode semi-centralization that Dash relies on and I see ZCash as more adoptable, desirable and permissible to higher liquidity use than Monero, Verge, et al. Plus, at these price levels, ZCash seems like the better value play compared to Monero and Dash.

Biggest dunce if you are selling right nowIf you are selling right now, you have to be the biggest dunce I have ever met. I have always been spot on, and when glizzy goes long, the whole world does.
I am not a financial advisor. Do your own research when making decisions.


nice double bottom & head & shoulders possibly forming.after being dragged down by BTC, ZEC is massively oversold.
looks to be currently forming a nice inverse head and shoulders reversal pattern & has already formed a double bottom coupled with some bullish divergence on the MACD.
Could this be the reversal? or will it get dragged down even more.
i am personally in the trade as seen by the RR tool on the chart. GL!


The ambitions of ZcashMy Market Advisor generated a LONG entry signal at market price of 287 USD,
in retrospect, it is clear that large buyers have never stopped buying Zcash, so the recent sale, which was probably due to panic selling triggered by the decline in bitcoin, It was driven mainly by smaller investors who are now going back to buying.
Graphically seems to be actually configuring a head shoulders upside down so the graphical analysis confirms when anticipated by the advisor obviously the doubts remain on the timing of this recovery, but I’m trying to sketch a hand drawing to simulate what price action might be in the next few days.
If you want to see all the signals generated by Marketmiracle advisor in real time you can visit marketmiracleadvisor.com is a free service and does not require any type of registration.

ZECUSD Inside Candle (High at 323.99)Inside Bar Candlestick High is 323.99. Mother Bar High is 324.09.


ZCASH NOT OBSOLETEHello traders and trenders,
Here I present to you an undiscovered, forgotten X100 money maker with the same identical potential like Bitcoin (even better). Look at that volume "OMG".
I can´t see the future but I know risk/reward :).
Let me know what you think, or don´t...
MMM (Make Motherf.ckin Money)
Invest your money wisely, be patient.