ZECUSD trade ideas

zcash chart idea possible cup and handle i think there might be a cup and handle action soon to where we maybe gain over $230 this is just an idea

OOOFI may have entered too early. We're either looking at a scamwick or an actual correction to the support of the "bigger picture" trend line. If that is so, I don't mind some zcash at ~$85, but it's so hard to give up my current position. May just hodl, or may stop out at around $120 to prevent alcoholism. Let's just hope it's a fakey and we'll see zcash nibble $300 soon. BTC is very much still influencing this price action too, but not for long as ZECBTC chart is looking fairly bullish to me. Feck BTC dominance, it's alt season.

ZCASH : PRICE ACTION IN HIGH TMF - PRICE IS GROWING ! 🔔Hello Everyone ! ! I hope you'll Appreciate our Advanced Analysis on Price Action !
Check the Link on BIO and If you LIKE this analysis, Please support our page by hitting the LIKE👍 button
Feel free to request any pair/instrument analysis or ask any questions in the comment section below.
Strategy : BULLISH CHANNEL + FIBO RETRACEMENT
Have a Good Take Profits ! ! !

Potential price action ZEC.If ZEC breaks to the upside of the Symmetrical Triangle, we may expect the price to reach the price target of 260.
Green= Support
Red= Resistance
Disclaimer: this is not trading advice, trade at your own risk.


long $ZECUSD for $715+last time I predicted a price above $100 when $zec was at $58. Now I am long on $ZEC for $715+
Super Algorithm Indicator is bullish

zcash chart idea for long term this is just an idea of mine on how zcash is gonna go looks to me we gonna have a gain soon or later just time will tell as we go


ZCash is on the verge of breaking out of an Ascending Triangle.Zcash is the one coin I don't want to chart about, I'd like it to stay cheap for a few years to accumulate, lmao.
It appears as though Zcash is about to break the red horizontal resistance of the pattern, and if not the green upward sloping support will need to hold for any validity of the pattern. Unless there's a fake-out to the downside.
On the RSI there is an Ascending Triangle pattern similar to the price, there's a series of higher lows and moderately higher highs at the horizontal resistance of the pattern. The horizontal resistance dates back into February and probably longer if I charted a longer time frame, it's possible Zcash sees some rejection.
If there is some strong resistance at the horizontal area of the pattern I have drawn a hypothetical scenario in blue.
The KST is displaying a bullish cross where I have placed the blue downward-sloping finger.

ZEC Short Term MoveSeeing zec heading towards the next major level, probably at around 260. This is a key level in the Fibonacci extension (2.618). Could be a good idea for some short-term play. Let's see how it plays out

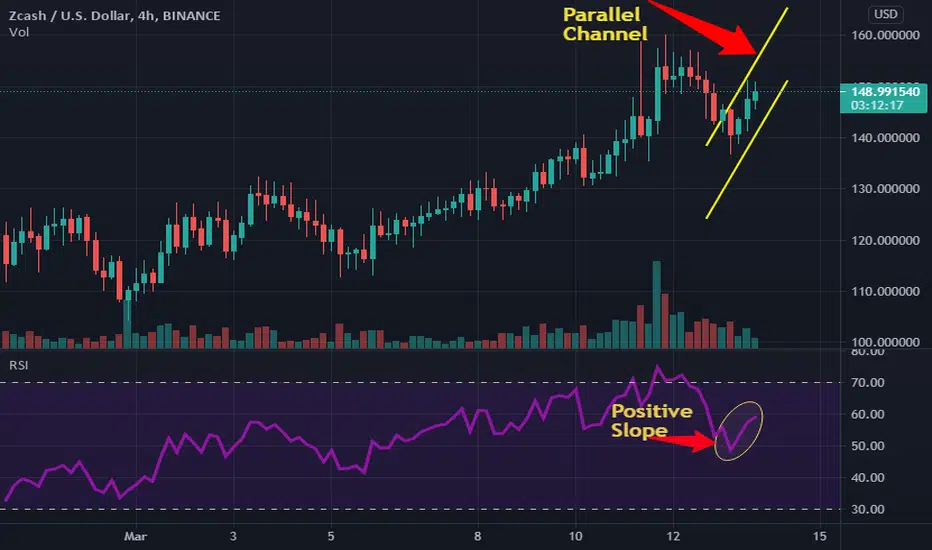
TECHNICAL INDICATOR SUGGEST A BULLISH MOVE FOR ZEC PRICE.The daily chart of ZEC hints at the start of a bullish move. On coming to the shorter time frame of 4 hours, the coin has formed a upward parallel channel. If the price breaks above 5% of the current position, it can see a rally upto $200 in upcoming trading sessions.ZEC price can also see a new low if it comes below the channel.
Kindly comment your thoughts below
ZEC/USD Long Position, Positive Sign for Upwards MovementAfter breakout ZEC/USD is holding strong.
Analyse
Resistance became new support.
RSI respecting trendline and MACD shifting in upwards movement.
Expect Upwards Movement in upcoming 2-4 weeks.
Expectation:
Atleast hitting resistance of 320 dollar before 30 April.
Maybe hit 190 dollars and bounce a bit back and push trough resistance to 230 dollars, then bounce back from 230 and go to 320 dollars. Maybe it will go at once, depends on the power of the bulls.
It would be healthier if it hit resistance, came back to lower end of the channel for catching breath to steam upwards. Otherwise it will be too much of pumping, and what goes up fast. comes down with the same speed.
Position to hold = LONG.
*Not financial advise, tip for more charts*


Zcash Live Fractal Scalping;Tickchart to MonthlyAanalysis\Step28NEW DAY
NEW FISH.
UPDATE; EDUCATE.
Enjoy.

zcash chart i made hoping to see something happen soon i am new to this charting if any tips or ideas would be great this is just a idea of mine

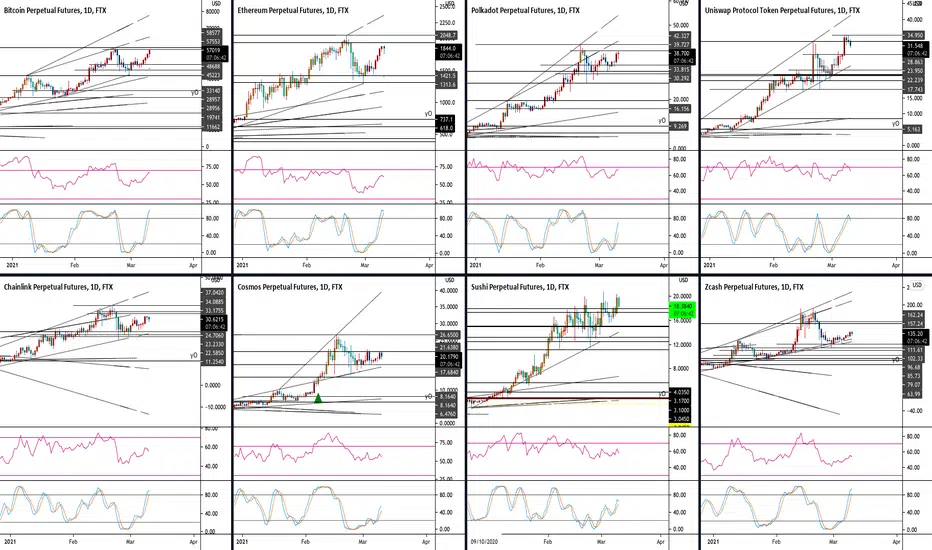
brypTo boNaNzaThese are 8 brypTos I am (re)accumulating since February's dip, in anticipation of an absolutely massive Q2. Also, Q2 price targets.
________
$BTC 113,395
$ETH 4,013
$DOT 81
$UNI 64
$LINK 73
$ATOM 52
$SUSHI 41
$ZEC 339
________
ZECPERP LONGIn the bull market the pair is bouncing off the support trend line and is trading above our moving average; we are targeting new supply zones


just a thought so from what i can see we might be able to brake 150 in the next few days hopefully only time will tell

