Awaiting ZEC Weekly Candle Currently in a big pennant. Macro trend resistance lies around $110. Positive weekly candle could break price from range and begin to head towards the major resistance levels as outlines in previous posts of mine. Negative weekly candle could push price to the bottom of pennant near $50 or lower if that does not hold as support.
Not financial advice.
Like if you appreciate my analysis.
Best wiShes.
ZECUSD trade ideas

ZEC Up or Down?Is it going to break this down trend and jump up to $90 or retrace back down to $50? Difficult call to make considering the upcoming halving and the complicated macro situation.....

ZECUSD ( Head and Shoulder Patter )ZEC/USD Currently trading at $62
Short Entry-level $ 62 - 64
Stop loss ( Resistance) : Above $67
Target 1 ( support level 1) : $ 50
Target 2 (Support level 2) : $37
Risk Reward Ratio: 1 : 3
ALWAYS KEEP STOP LOSS....

ZECUSD H16: BEST Level to SHORT IT 35% gains(SL/TP)(UPDATED)Why get subbed to me on Tradingview?
-TOP author on TradingView
-15+ years experience in markets
-Professional chart break downs
-Supply/Demand Zones
-TD9 counts / combo review
-Key S/R levels
-No junk on my charts
-Frequent updates
-Covering FX/crypto/US stocks
-24/7 uptime so constant updates
ZECUSD H16: BEST Level to SHORT IT 35% gains(SL/TP)(UPDATED)
IMPORTANT NOTE: speculative setup. do your own
due dill. use STOP LOSS. don't overleverage.
Tagged as SHORT as I expect more losses
short and mid term.
🔸 Summary and potential trade setup
::: ZECUSD 16hour chart review
::: expecting strong correction soon
::: H*S confirmed / massive rejection
::: overall very weak chart
::: rejected from heavy resistance level
::: BEARS will take over from here
::: TP BEARS 42/44 USD
::: 35% downside pending
::: BCH hard fork will trigger DUMP
::: TP BEARS is 35% gains
::: FINAL TP is 44/42 USD
::: recommended strategy: SHORT IT
::: TP BEARS 25%/35% gains
::: SWING TRADE: SHORT/HOLD IT
::: correction not over yet
::: good luck traders!
::: SHORT and get paid. period.
🔸 Supply/Demand Zones
::: N/A
::: N/A
🔸 Other noteworthy technicals/fundies
::: TD9 /Combo update: N/A
::: Sentiment mid-term: BEARS

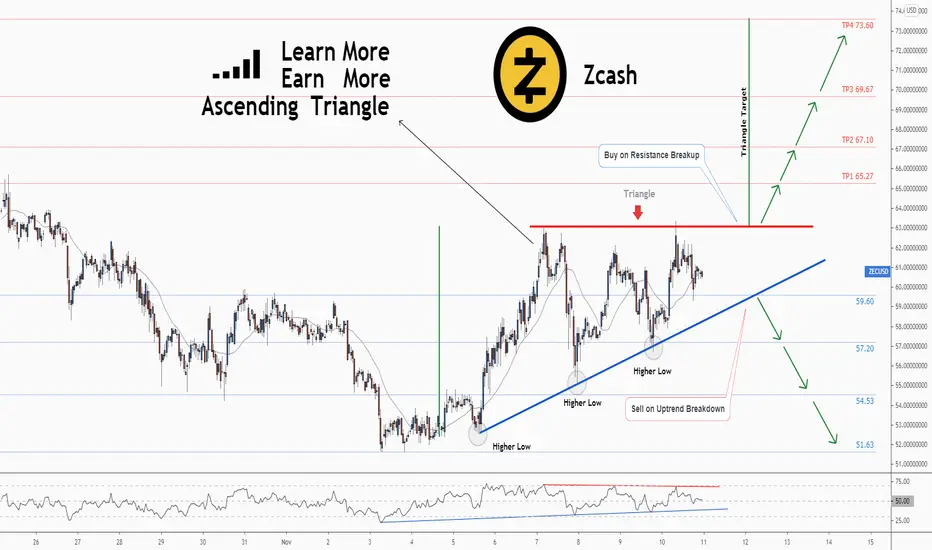
💡Ascending Triangle in ZECUSD - "Learn More Earn More" With USAscending Triangle Definition:
An ascending triangle is a type of triangle chart pattern that occurs
when there is a resistance level and a slope of higher lows .
It is defined by two lines:
. A horizontal resistance line running through peaks.
. An uptrend line drawn through the bottoms.
The higher lows indicate more buyers are gradually entering the market
and buying pressure increases as price consolidates moving further towards the apex.
An ascending triangle is classified as a continuation chart pattern .
If price can break through the resistance level, that level will now act as a support level.
Breakouts can also happen in both directions. Statistically,
upward breakouts are more likely to occur, but downward ones seem to be more reliable.
In most cases, the buyers will win this battle and the price will break out past the resistance.
But Sometimes the resistance level is too strong,
and there is simply not enough buying power to push it through.
Therefore you should be ready for movement in EITHER direction.
ENTRY:
We would set an entry order above the resistance line and below the slope of the higher lows .
TARGET:
Target is approximately the same distance as the height of the triangle formation.
❤️ If you find this helpful and want more FREE forecasts in TradingView
. . . . . Please show your support back,
. . . . . . . . Hit the 👍 LIKE button,
. . . . . . . . . . Drop some feedback below in the comment!
❤️ Your Support is very much 🙏 appreciated! ❤️
💎 Want us to help you become a better Forex trader ?
Now, It's your turn !
Be sure to leave a comment let us know how you see this opportunity and forecast.
Trade well, ❤️
ForecastCity English Support Team ❤️

zcash upcoming halving and emission scheduleZcash entering its 5th year since the genesis block and coming closer to its first halving around 18th November which will reduce inflation from 33% to 12.5% in this year.
The contolled supply for zec is like this:
1. Year | Total Zec: 2.65m | Mined Zec: 2.625m | Inflation: infinite | Stock to flow n.d.
2. Year | Total Zec: 5.25m | Mined Zec: 2.625m | Inflation: 100% | Stock to flow 2:1
3. Year | Total Zec: 7.87m | Mined Zec: 2.625m | Inflation: 50% | Stock to flow 3:1
4. Year | Total Zec: 10.5m | Mined Zec: 2.625m | Inflation: 33% | Stock to flow 4:1
--------- we are here ---------
5. Year | Total Zec: 11.8m | Mined Zec: 1.313m | Inflation: 12.5% | Stock to flow 9:1
6. Year | Total Zec: 13.1m | Mined Zec: 1.313m | Inflation: 11.1% | Stock to flow 10:1
7. Year | Total Zec: 14.4m | Mined Zec: 1.313m | Inflation: 10% | Stock to flow 11:1
8. Year | Total Zec: 15.8m | Mined Zec: 1.313m | Inflation: 9.1% | Stock to flow 12:1
9. Year | Total Zec: 16.4m | Mined Zec: 0.656m | Inflation: 4.2% | Stock to flow 25:1
after the halving 50% of all zec are already mined and inflation pressure will start to fade out

ZECUSD good position it has a good position to long cuz it is on the support line and it's kinda reliable line
whats your opinion / share your opinion with me .
i glad to hear it.

ZCash/USD bearishdoes not have good support, it is dangerous to buy, but it is not bad to buy partially


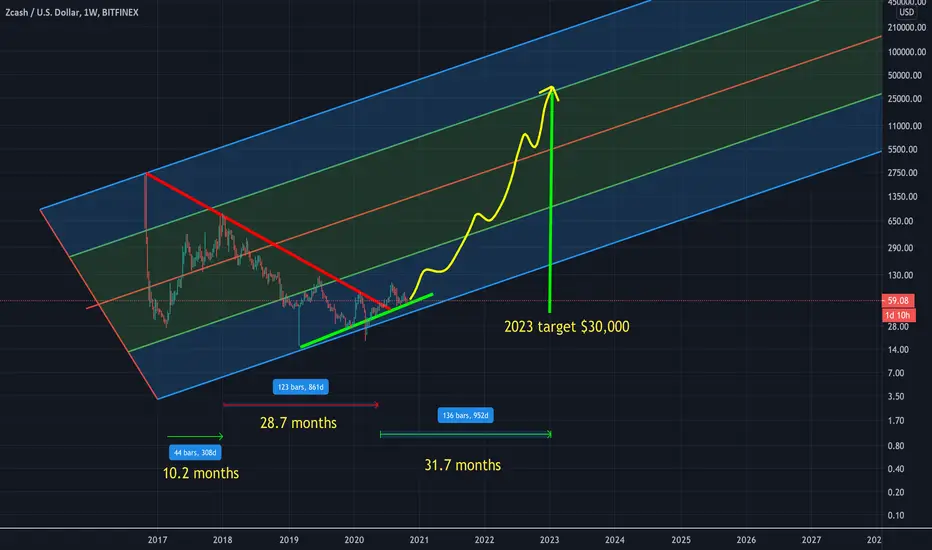
Zcash Zcash target range posted in chart, break out from resistance should have a nice run up by 2023

Z Cash officially in Wave 3. ZECUSDOh Yes! The fun is just getting started. That was quite a large Wave 1 (compared to top ten cryptos), and it looks like there is plenty more to give. First initial Fib Goal charted in. Obviously if we retrace lower than SubWave 1 start, then all bets are off, but this is somewhat unlikely at this stage. Strap yourselves in and NFA.


Short Term trade idea for ZECThis is a LONG idea as ZEC gets closer to the date of the halving on Nov17. If price retraces to the 63 level, looking to enter then exit prior to the halving date for a small gain.

This is what would happen if ant man infiltrated the crpyto markA meme drawing of something that might or might not happen.


ZCash We had tested the support line and there was formed a rising channel with the falling wedge inside.
Target - the middle line of this channel and more.
Fundamental analysis:
17 November 2020 (or earlier)
Halving

ZEC may be in troubleFalse breakout of from key level, false breakout from inverse head and shoulders (not yet invalidated). Remains to be seen if it bounces of the channel support otherwise a breakdown from the channel will send price to 31.9
