ZECUSD ❕ low volumeTrading volumes decreased on price correction.
ZEC fixed above 50EMA on 4H TF.
The RSI chart indicates a rebound is coming soon at 1H TF.
I think the price will rise after overcoming the resistance level.
ZECUSDT.P trade ideas

ZEC TO BUST A MOVE?0.236/0.382 first targets once this triangle resolves to the top with a perfect 0.886 bounce
To be monitored the next weeks, could be the beginning of something big!
---
If you like my content, if it helps you gain profit, give it a like!
Thanks!
---
Hold my beer pls
----
No financial advice, do your own research, don't be stupid
#ZEC/USDT - Long - Potential 9.14%Direction: Long
Market: Spot
Risk: 0.25% - 1%
#USDT_ZEC
Exchange: BINANCE
Timeframe: 360
TP1: 32.96
Entry: 30.21
STOP: 27.46
Entry Conditions:
| Downtrend break with volume
| EMA20 Break
| Support
| RVOI trendbreak

Zcash (ZEC) forming bullish BAT for upto 21% pumpHi dear friends, hope you are well and welcome to the new trade setup of Zcash (ZEC) with US Dollar pair.
Previously we caught more than 18% pump of ZEC as below:
Now on a daily time frame, ZEC is about to complete a bullish BAT move for the price reversal.
Note: Above idea is for educational purpose only. It is advised to diversify and strictly follow the stop loss, and don't get stuck with trade.

zec usdt sell nowlooking for a third wave, selling pressure good open 2 positions and take first profit as soon as possible second position ride till down with trailing stop

stop hunt it is a very good stop hunt and when price back to this level we can get a long position
in TR we see this setup

good short positionin Daaily time fram we have bearish trend and in lower time fram we have a TR and break it and complete pullback now we can get a short position do yo agree with me?

ZEC slowly moving upI think that we bottomed out here. The price is at COVID levels (especially looking at it inflation adjusted) and there have been technological improvements in the meantime.
Target ~44$ on May 1st 2023

ZEC running wildthis ones mooning, clear deviations but well see how ti goes. lots of folks want privacy, this coin probably gets banned

ZECUSD ❕ lower boundary of the channelThe ZEC has consolidated above 200EMA on the 4H TF.
The 50EMA broke above 200EMA on the 4H TF.
The RSI chart is moving in the buy zone (4H, 1H and 30m TFs)
I believe that the asset will continue to rise after fixing in the channel.

ZECUSDT Elliott Waves AnalysisHello friends.
Please support my work by clicking the LIKE button👍(If you liked). Also i will appreciate for ur activity. Thank you!
Everything on the chart.
Entry: market and lower
Targets: 40 - 50 - 60
after first target reached move ur stop to breakeven
Stop: (depending of ur risk). ALWAYS follow ur RM .
risk is justified
Good luck everyone!
Follow me on TRADINGView, if you don't want to miss my next analysis or signals.
It's not financial advice.
Dont Forget, always make your own research before to trade my ideas!
Open to any questions and suggestions

$ZECabove 13ema
targeting 34.4 first..
reclaimed 200 ema on H4 lost it then wicked back and holding
been a while....

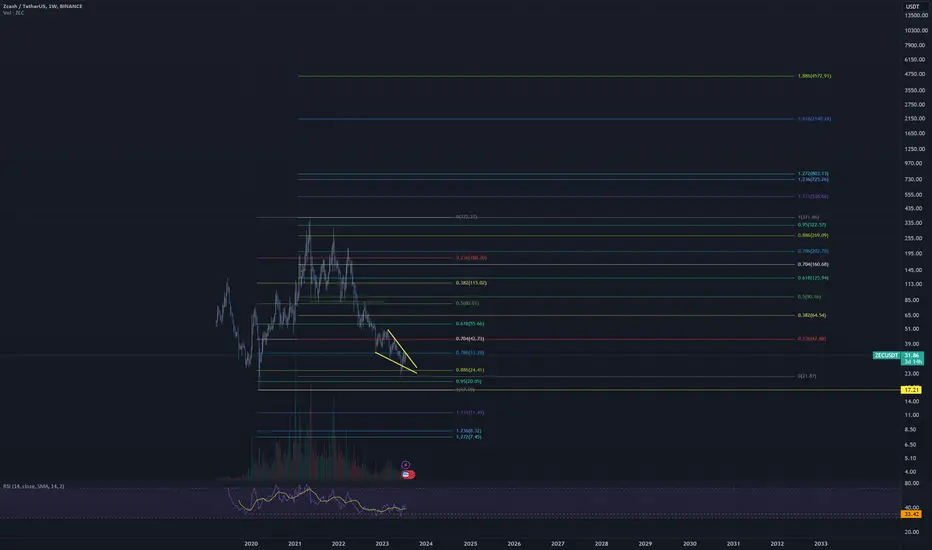
ZECUSDTZECUSDT: Channel trading
Price fixes below high volumes
Most likely, for some time the price will be traded in the channel, it is not worth buying in the middle of the channel.
Support about 39-26
If the $26 support is not triggered by the end of the bear market, the price will be looking for a new bottom.
--------------------------------------------------------------------------------------------------------------
✅If you like the idea, don't forget to subscribe and rate like👍

ZECUSD ❕ bullish divergenceTrading volumes, RSI chart and price movement have formed a bullish divergence on the 4H Timeframe.
RSI values are near neutral (1H and 30m TFs)
ZEC has broken up 50EMA on 30m Timeframe.
I believe that the asset will start to bounce after it fixes in the channel.

End of correction ZCASHAfter a long correction process, I think this currency is ready for holding. According to Elliot waves, we are at the end of the downward trend, and I think we are in wave 5 of the Diagonal Diagonal pattern. Share with your friends and if you have an opinion, please let us know in the comments.
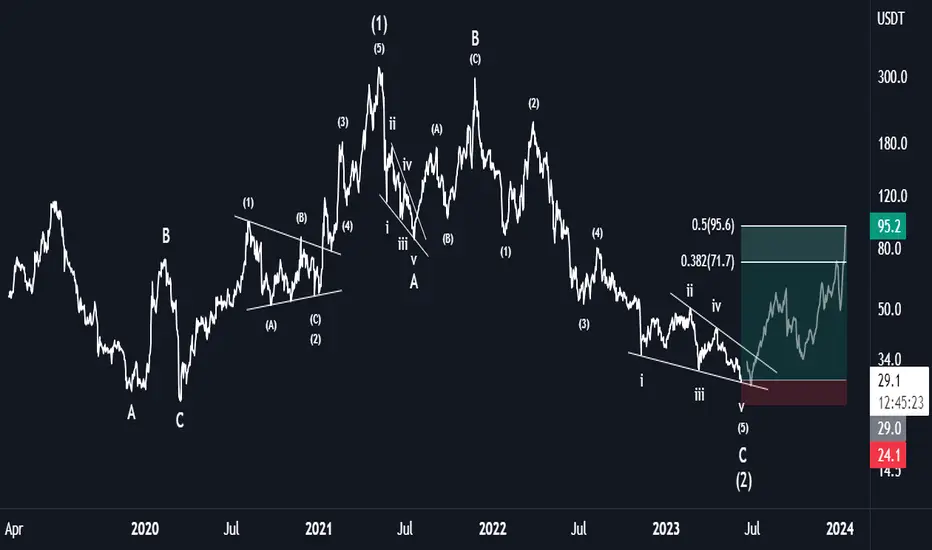
ZECUSDTTurkish description is below.
Im expecting a bull rally for zecusdt to hit 305 usd between 6 March and 1 May 2023. This comes from end of Wave C which made ending diagonal as shown on the chart.
Note that this post should not be considered as financial advise.
6 Mart ile 1 Mayis arasinda ZECUSDT paritesinin 305 dolar olmasini bekliyorum. Bunun sebebi C dalgasi biten diyagonal olarak yapmasidir.
Yatirim tavsiyesi degildir.

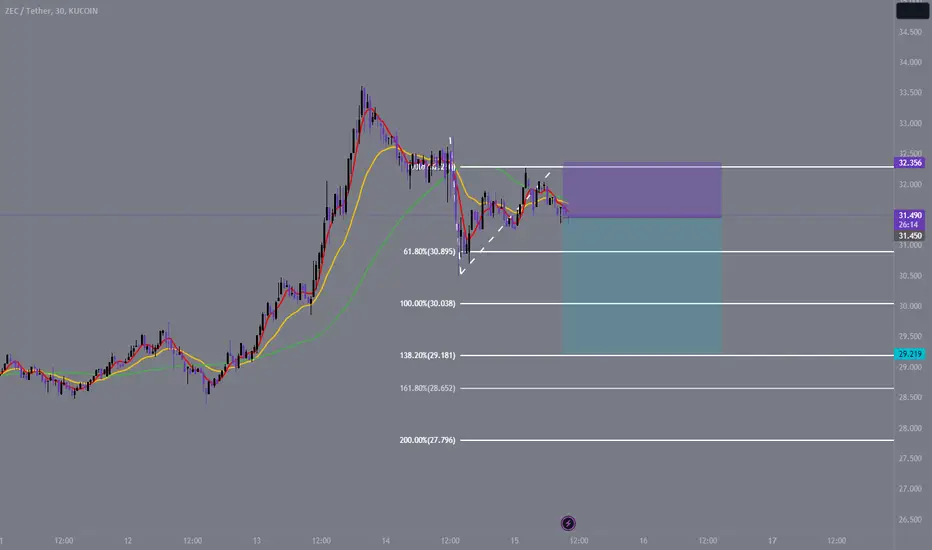
ZECUSDTZECUSDT broke through strong support and is under sell pressure. Currently the instrument is consolidating and seems like it will retest the broken level around $31 region, which is also the 3rd pivot for declining trendline.

A Corrective Phase May EnsueIn light of potential obstacles hindering ZEC's ongoing upward movement, a corrective phase may ensue, leading to a potential decline towards the support level of $32. Conversely, should buying pressure persist and successfully overcome forthcoming resistance, it is reasonable to anticipate further price appreciation towards the resistance range of $38 to $40. Additionally, the breach of the currency's downward trend line serves as a positive indicator, implying potential price growth. Therefore, in the event of a pullback, accompanied by a subsequent reaction, the probability of significant short-term currency growth towards the aforementioned resistance level is considerably high.
Furthermore, the Relative Strength Index (RSI) is currently at a level of 49. The RSI is a technical indicator used to assess the strength and momentum of an asset's price movements. A reading of 49 indicates a relatively neutral stance, suggesting that the current market conditions do not strongly favor either buyers or sellers.


Navigating the DowntrendThe analysis reveals that ZEC is currently trading within a downtrend channel on the daily timeframe. Market strength is yet to materialize, indicating a lack of upward momentum. The resistance level to overcome is situated at $37.4, and a successful breach of this barrier would propel ZEC towards the $42-$43 resistance zone. Conversely, a break below the critical support level of $30 would trigger substantial selling pressure.
In conjunction with these observations, the Relative Strength Index (RSI) stands at 47, indicating a neutral position. This implies a balanced equilibrium between buying and selling pressures, suggesting a lack of extreme bullish or bearish signals for ZEC. Traders and investors should closely monitor the RSI for any notable shifts that could potentially indicate a change in market sentiment.

Time to Buy ZECHello Traders!
Welcome back to another trade with analyst Aadil1000x.
Today we will benefit from this dip and buy it from the reversal level. The first target will be the start of this fall.
ZEC Buy now @ 32.24
Stoploss 31.40(-2.6%)
Target 1, 33.18(+2.82%)
Final Target 34.29(+6.36%)
Don't forget to hit the like button and follow to stay connected.

ZECUSD ❕ reboundZEC rebounded from the lower boundary of the channel.
The asset broke through 50EMA on the 4H Timeframe.
50EMA broke through 200EMA on the 1H Timeframe.
Price will continue to rise after holding support.
