ZEC TRADE ENTEREDZEC inverse head & shoulders confirmed on hourly and position entered. possible retest on neckline before pump.
ZECUSDT.P trade ideas

ZEC PERSONAL ANALYSIS IN THE LONG TERMChart shows common supports and resistances based on the Fibonacci and price action. The total evaluation for the ZEC token is neutral-bearish. The coin itself did not establish any higher highs, even though it was still in the recovery phase after the FOMO pump, it got rejected for a triple top on the same resistance which concludes the bearish tone that no investors are interested in keeping it in that range which can send long term confidence investment in this asset decently low. The coin has a very stable customer interest below the 0.236 and some areas above it.
The recommended strategy for this coin is to long it from within the .236 and lower areas of .382 FIB during a BULLTREND in both larger and smaller time frames. If the smaller time frame is bearish and the general trend is bullish, you may find the neutrality of the coin difficult to trade/scalp/invest since it is an alt coin. It is also recommended to short it when it reaches heavy resistance, in case that the general trend is now bearish and a manipulation pump happened reaching the heavy resistance, short is the best strong move.

zecusdt
👑 @F̲X̲o̲n̲e̲4̲a̲l̲l̲ 👑 VIP 🚀🚀
🟢 #ZEC- USDT 🔚BINANCE
💰 Buy now: 171.7
🔸TARGET 🎯
🔹 224.5
🔹260.5
🔹297.7
📝 RATIO: 10% Risk

ZEC/USDT (ZCash)ZEC/USDT chart showing major support and resistance levels / trendlines. Soon we will hit 300 USD Again imo :)

Zcash due for a decision this weekend or sooner.can't drift around at $215 - $230 forever
if it falls under the white horizontal. expect $200 -190
if it breaks up through the white diagonal, expect $300 quickly
EoY target remains $1,000 - assume Bitcoin reverses and prints new ATH in December also

ZECUSDT Breaking Support ZonesZECUSDT is in a downtrend held by 245.386.
201.238 is the target for a bias of 187.098
.
Khiwe
On this profile page, the shared analysis, ideas, and also, the strategy of a chart belong to Khiwe with some being influenced. The technical set-ups are speculative, they are not guaranteed for accuracy or completeness in the form of any content; it is not to advise on financial markets. Please apply your own analysis and confirm it with price action.

ZEC (Zcash) set to explodeZEC left the local triangle area now closing above the top descending trendline.

ZEC ( zed cach ) going to moon !!1 - flag pattern
2 - ichi support in 1D time frame
3 - MA 200 support in 4H time frame
I believe ZEC has been persecuted !!
Old and original coins but with low growth.

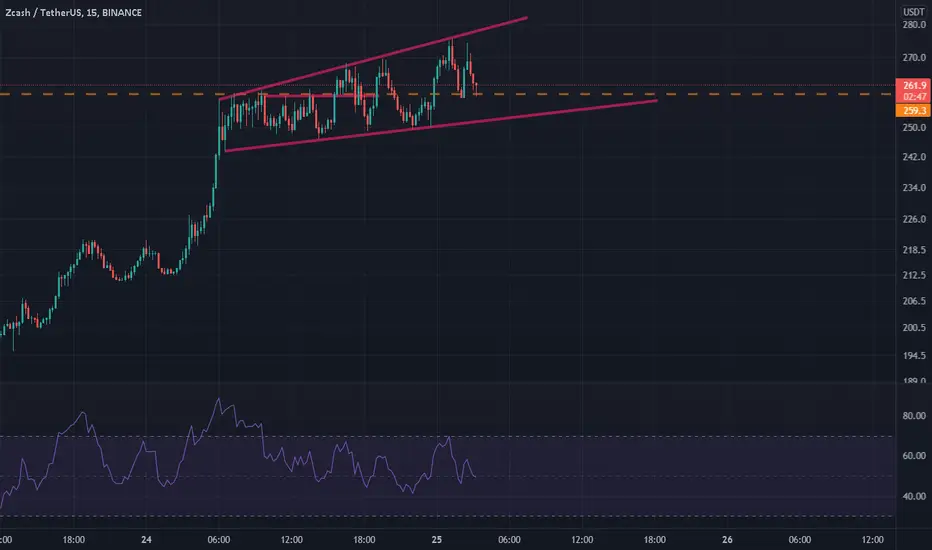
ZECUSDT LONG SETUPZEC is still making a correction in the form of this falling wedge, we can see range is tightening and i expect a breakout to occur soon. We are waiting for a 4hr higher high to close above the confluence of resistance before we can look for a possible entry to long with leverage.


ZEC Trade ThesisZECUSDT
(RSI) under 30 / Elliot wave with ABC correction. Bottomed out @ our support lines.
Entry: $228
EXIT: $269
SL: $212

ZECUSDTHello Crypto Lovers,
Mars Signals team wishes you high profits.
Warning: This is just a suggestion and we do not guarantee profits. We advise you analyze the chart before opening any position.
Wish you luck

ZEC failed the line but seems to have bounced on Fib......ZEC failed the line but seems to have bounced on Fib 0.382 .... hope black friday is over and come back on Green!

Zec what the heckIm bullish on Zec. Its a hodl in my book. Not financial advice. Price projection is based on FIB projection.

ZECUSDT - TICKER REQUESTThe first thing that is notable to me is the weekly candle.
Thats a very ugly looking reversal candle.
In a new week we need confirmation but i think ZEC will go a bit lower
Thanks for taking your time to check out my idea 😎😎! Often, my ideas are fast gone from the front page because there are so many ideas on the platform and the algo picks the one with more likes 🤖🤖. I think once I have around 20 likes/idea my idea will be shown in front 🥳🥳. It would be awesome if you could like my idea, (only if you really like it of course) 🤪! I believe that the more we can interact with each other, and share thought about an idea, the more we can learn! 👩🏫🧑🏾🏫👨🏻🏫
Furthermore, I made a challenge for myself, I will add 1 idea for every new follower🦹♀️ So if I have 1 follower each day, I will add 1 idea. If I have 10 followers, I will add 10 🏌️♂️ It’s fun for me and you! More followers = more ideas = powerful community! 💪💪💪 Besides, all the ideas are … FREE 🥳🥳🥳
⚠️⚠️ If you want to know how my previous ideas played out, > push the play button on my previous ideas and check it out 🕵️🕵️
Is there a ticker you want me to look into? Let me know in the comments below ⬇️⬇️⬇️

zec analyse zec usdt analyses
time frame weekly
cup and handle harmonic pattern
what is your forecast?

ZECUSDT # 001 ( The rout what we expect !!! )Hello dear friend.
Good day .
This is ZECUSDT update with help of Gann Support & Gann Box .
Total market is still bearish but this could be happen .
Thanks for your comments & support.
Good luck & safe trade.


ZEC seems to bounce....ZECUSDT seems to bounce on the yellow line... thinks is buying opportunity to go over 300 again.

ZECUSDTShort term
Entry 160 $ - 167 $
TP1 180 $
TP2 190 $
TP3 .......
Stop lose 153 $
........................
Long term
Entry 160$ - 167$
TP1 190 $
TP2 220 $
TP3 300 $
TP4 .....
Stop lose 110 $
NOT FINANCIAL ADVICE

ZECUSDT Technical Analysis⏳ Spot
💎 ZECUSDT has been making HHs and HLs in the ascending channel. Right before the major resistance we see several green candles which indicates the price has the potential to pump and after the retest and pullback continues the bullish move.
🌐 Tradingview
💵 Invest Only 5% of your Portfolio
🎳 Entry/Pullback now or from 267.2 - 237.5
☕️ TP1 293.6
🍺 TP2 319.3
🍻 TP3 345.7
🍾 TP4 372.8
🍷 TP5 400.0
🍸 TP6
🍹 TP7
🎁 TP8
🚫 SL 237.5 - 216.2
Good Luck 🎲
Check the Links in Description and if you LIKE this analysis, please support our page and Ideas by hitting the LIKE 👍 button. ❤️ Your Support is really appreciated! ❤️
Traders, if you have your own opinion about it, please write your own in the comment box. We will be glad for this.
Feel free to request any pair/instrument analysis or ask any questions in the comment section below.
We will have more FREE forecasts in TradingView soon
Have a profitable day 😊👍🏻

💡Don't miss the great buy opportunity in ZECUSD @ElectricCoinCoTrading suggestion:
". There is a possibility of temporary retracement to the suggested support line (233.8).
. if so, traders can set orders based on Price Action and expect to reach short-term targets."
Technical analysis:
. ZECUSD is in an uptrend, and the continuation of the uptrend is expected.
. The price is above the 21-Day WEMA, which acts as a dynamic support.
. The RSI is at 62.
Take Profits:
TP1= @ 268.2
TP2= @ 288.3
TP3= @ 345.7
TP4= @ 379.7
TP5= @ 406.4
SL= Break below S2
❤️ If you find this helpful and want more FREE forecasts in TradingView
. . . . . Please show your support back,
. . . . . . . . Hit the 👍 LIKE button,
. . . . . . . . . . Drop some feedback below in the comment!
❤️ Your support is very much 🙏 appreciated!❤️
💎 Want us to help you become a better Forex / Crypto trader?
Now, It's your turn!
Be sure to leave a comment; let us know how you see this opportunity and forecast.
Trade well, ❤️
ForecastCity English Support Team ❤️
