Zcash - investment in privacyOne of the main so-called privacy coins is Zcash.
This cycle was more focused on memecoins, so a lot of functional coins were left out. I believe that privacy coins will also experience rise if not delisted from major exchanges.
You can look at ZEC chart. First of all, it stayed within accumulation zone for quite some time in 2023-2024 so large volumes were traded there.
During the latest correction ZEC proved to stay quite strong, and has already outperformed this correction.
The first and I think most realistic target is around $140.
ZECUSDT trade ideas

Zcash (ZEC/USDT) – 30-Minute Timeframe AnalysisZcash (ZEC/USDT) – 30-Minute Timeframe Analysis
We’ve observed an Inverse Head and Shoulders pattern forming in Zcash (ZEC/USDT), signaling a potential bullish reversal. The price has successfully broken through the resistance level, confirming the pattern and indicating a move higher.
The Target
Based on the breakout, the next target aligns with the black level zone, which serves as a key resistance and profit-taking area.


Crypto LONG Signal #ZECUSDT. Potential profit 17%
30m TF. BINANCE:ZECUSDT is showing growth alongside increasing volumes, indicating heightened buyer interest. The price has reached 67.93 USDT and is targeting a breakout of key resistance.
🔑 Key Levels
Support:
67.45 USDT – the nearest support level where demand has been observed.
63.71 USDT – a stronger support level maintaining the current uptrend.
Resistance:
75.33 USDT – the first target after a breakout.
76.88 USDT – the secondary resistance level.
79.50 USDT – the key target for profit-taking.
🚩 Trading Strategy
Entry Point:
Consider opening a long position above 67.93 USDT.
Stop-Loss:
Place a protective stop order below 67.45 USDT to minimize risks.
Take-Profit Targets:
75.33 USDT – the first target for partial profit-taking.
76.88 USDT – an intermediate target.
79.50 USDT – the final target.
📈 Technical Analysis
Rising volumes confirm buyers’ readiness for further growth.
A price consolidation above 67.93 USDT will strengthen the upward impulse.
A retest of 67.45 USDT before the breakout could provide a good entry point.
💡 Recommendations
Monitor Volumes: Increased volumes during the breakout will confirm the strength of the move.
Manage Risks: Use sensible stop-loss orders to limit potential losses.
Analyze Dynamically: Use smaller timeframes (15m and 1h) for precise entry points.
Conclusion
BINANCE:ZECUSDT shows strong upward potential. Watch for a breakout above 67.93 USDT to take advantage of the current market conditions.

ZEC/USDT Chart Analysis #Zcash ( SEED_DONKEYDAN_MARKET_CAP:ZEC ) / USDT Technical Analysis
The price has broken out of a descending wedge pattern, signaling the start of a bullish reversal. After bouncing off the Fibonacci 0.618 retracement level, ZEC is poised to test its first resistance at $66.87. A successful break above this level could lead to further gains toward $76.36 and ultimately $80.

ZECUSDT: What the Market Is Whispering About Today - Zcash◳◱ On the BINANCE:ZECUSDT chart, the Super Trend pattern suggests a pause in volatility, potentially gearing up for a breakout. Traders might observe resistance around 66.05 | 73.53 | 93.48 and support near 46.1 | 33.63 | 13.68. Entering trades at 59.68 could be strategic, aiming for the next resistance level.
◰◲ General Information :
▣ Name: Zcash
▣ Rank: 121
▣ Exchanges: Binance, Kucoin, Huobipro, Gateio, Mexc, Hitbtc
▣ Category / Sector: Payments - Currencies
▣ Overview: Zcash is a privacy-preserving cryptocurrency providing anonymous value transfer using zero-knowledge cryptography. The protocol provides the option for transactions to be either shielded, in which case they will be completely anonymous, or transparent, in which case they will be visible on the Zcash blockchain. Zcash pays out a portion of its block rewards, called the "Founder's Reward", to fund protocol development. It currently allocates the Founder's Reward to the Electric Coin Company and the Zcash Foundation who develop and steward the Zcash protocol respectively.
◰◲ Technical Metrics :
▣ Current Price: 59.68 ₮
▣ 24H Volume: 26,131,359.620 ₮
▣ 24H Change: 8.786%
▣ Weekly Change: 4.11%%
▣ Monthly Change: 23.08%%
▣ Quarterly Change: 106.32%%
◲◰ Pivot Points :
▣ Resistance Level: 66.05 | 73.53 | 93.48
▣ Support Level: 46.1 | 33.63 | 13.68
◱◳ Indicator Recommendations :
▣ Oscillators: SELL
▣ Moving Averages: STRONG_BUY
◰◲ Summary of Technical Indicators : BUY
◲◰ Sharpe Ratios :
▣ Last 30 Days: 2.32
▣ Last 90 Days: 2.64
▣ Last Year: 1.06
▣ Last 3 Years: 0.01
◲◰ Volatility Analysis :
▣ Last 30 Days: 1.50
▣ Last 90 Days: 1.17
▣ Last Year: 0.94
▣ Last 3 Years: 0.88
◳◰ Market Sentiment :
▣ News Sentiment: N/A
▣ Twitter Sentiment: N/A
▣ Reddit Sentiment: N/A
▣ In-depth BINANCE:ZECUSDT analysis available at TradingView TA Page
▣ Your thoughts matter! What do you think of this analysis? Share your insights in the comments below. Your like, follow, and support are greatly valued and help sustain high-quality content.
◲ Disclaimer : Disclaimer
The content provided is for informational purposes only and does not constitute financial, investment, or trading advice. Always conduct your own research and consult a qualified professional before making any financial decisions. Use of the information is solely at your own risk.
▣ Explore the Power of Charting with TradingView
Unlock a wide range of financial analysis tools, data, and features to elevate your trading experience. Take a tour and see the possibilities. If you decide to upgrade your plan, you can receive up to $30 back. Discover more here - affiliate link -

Zcash ($ZEC) / USDT Technical Analysis#Zcash ( SEED_DONKEYDAN_MARKET_CAP:ZEC ) / USDT Technical Analysis
The price has broken out of a descending wedge pattern, signaling the start of a bullish reversal. After bouncing off the Fibonacci 0.618 retracement level, ZEC is poised to test its first resistance at $66.87. A successful break above this level could lead to further gains toward $76.36 and ultimately $84.27.


$ZECUSDT : Privacy Coin Ready to Rally?BINANCE:ZECUSDT , a leading privacy-focused cryptocurrency, has demonstrated a strong rebound following a recent market downturn. This resilience has captured the attention of the crypto community, sparking renewed interest in the coin. Technically, BYBIT:ZECUSDT.P has exhibited a pattern of overcoming resistance levels, forming higher highs, and suggesting a bullish trajectory. The current resistance at $80 is a critical hurdle. A successful breach of this level could potentially unleash significant upward momentum. Traders are advised to exercise prudent risk management practices, including setting stop-loss orders, to mitigate potential losses.
COINBASE:ZECUSD Currently trading at $53
Buy level: Above $44
Stop loss: Below $34
Target : $200
Max Leverage 3x
Always keep Stop loss
Follow Our Tradingview Account for More Technical Analysis Updates, | Like, Share and Comment Your thoughts

ZECUSDT Hits All Targets – 940% Profit Secured at 10x!ZECUSDT on the 1-Day timeframe delivered an outstanding long trade setup, smashing all profit targets and securing a remarkable 940% profit at 10x leverage.
Key Levels:
TP1: 41.78 ✅
TP2: 52.53 ✅
TP3: 63.28 ✅
TP4: 69.93 ✅
Technical Analysis:
The trade was perfectly executed using the Risological Swing Trading Indicator , which provided a clean entry at 35.14 with an SL at 29.77. ZECUSDT displayed strong upward momentum, supported by a clear price crossover above the Risological Trend Line, leading to a sustained uptrend. All targets were hit with precision, delivering massive gains.

Zcash, possible entry after the correction?Hello, fellow traders!
This is my analysis on Zcash (ZECUSDT).
1️⃣ Analysis
Before diving into Zcash’s chart, I first want to address the current market sentiment.
Bitcoin’s price remains within the demand zone of 97k – 100k, currently testing the support line of the uptrend channel (yellow channel). Bitcoin’s movements in the next few days will be critical as Bitcoin breaking below this channel could trigger fear throughout the market. If it manages to stay within the channel, however, bull rally may continue. The candle is currently bullish, which is ideal, but with 15 hours remaining until the close, things can always change. (I am using UTC-5 as my chart timezone.)
Ethereum’s candle is also bullish, and the price remains within the uptrend channel, which is ideal.
Dogecoin’s movements are also crucial, as it is leading the rally. However, it’s not looking too good for Dogecoin right now as its price broke below the channel yesterday. It would have been much more ideal if the price stayed within the channel like Bitcoin or Etherum but unfortunately that didn’t happen. That said, there’s still a chance for improvements.
The price is still within the Price Action Zone (PAZ) and despite the current candle being bearish, the long lower wick suggests that most of today’s decline has been recovered. As I write, the candle is forming a semi-doji star, with the price only just few ticks below the open price.
If the price manages to reenter the uptrend channel, it could signal a strong possibility of the rally continuing.
Lastly, here’s a BTC Dominance chart. We’ve seen a lot of volatile movements for yesterday, but the candle eventually closed as a perfect doji star. (Open and close were same at 56.94%) While seeing a perfect doji star is notable, Dominance has only been increasing today (Open and low are same at 56.93%). This reflects the psychology behind the curret market of people preferring Bitcoin over altcoins as the market faces growing uncertainties, which could also explain Bitcoin’s performance today. But we still have around 15 hours left until the candle closes and shift of momentum – similar to yesterday – remains possible.
Ideally, we’d like to see the Domiance to drop as we are seeking to invest in altcoins. With this context, let’s now dive into the Zcash’s chart.
Zcash has also suffered from the recent correciton, with its price dropping 21%. However, we see a bullish hammer candle for yesterday (or a close doji-star as I want to call it 😅). The long lower wick also suggests that the buyers were able to absorb the selling pressure. Today, the chart is currently showing another green hammer, but the candle has been fluctuating between red and green so we will have to wait and see how it closes.
The candle from the day before yesterday touched the 49.44 level (which was previously a major resistance level) before retracting. Additionally, yesterday’s candle’s low also came close to the resistance line of the uptrend channel. Both are positive signs suggesting a potential rebound.
2️⃣ Expectations
With 15 hours remaining until the candle closes, a bullish close could present a possible entry for long. (As I write, Dogecoin’s candle has just turned to green. However, this could be temporary, and we cannot be sure until the candle closes.)
3️⃣ Key approach
Our first strategy is to enter long after 3 consecutive bullish candles. With yesterday’s candle already bullish, we now aim for the current candle and tomorrow’s candle to close as bullish as well. If the circumstances are promising, we may consider entering before tomorrow’s candle closes.
We also must be mindful of the Price Action Zone as turbulence might occur – and in the worst cases, even a bearish rebound. It is always best to respect such zones, but the current market sentiments also tend to bypass major demand levels & zones.
4️⃣ Other approach
No other strategy for this one :)
5️⃣ Considerations
Zcash has a market cap of 956 million USD, which is very close to 1 billion. This crypto is definitely much safer than some of the other cryptos I’ve posted about which is positive.
I emphasize this in every post, but I can’t emphasize it enough – Zcash as well as any other cryptos will be heavily influenced by the movements of the giants. Keep watching these giants’ movements as well as the BTC Dominance chart to confirm market sentiment and stay cautious. Thanks!
React, don't predict! Stay disciplined and patient. Don't get greedy and be thankful.
God bless :)
James 1:5-8

ZECUSDT - where is support now? What's next??#ZECUSDT - zeecash is just near to his current supporting region that is mentioned on chart
That will be our key region for next move to any side.
Keep close that don't hold buying below that region.
One more important thing that below 54.30 we will go for cut n reverse on confirmation.
Good luck
Trade wisely

Zec long Analysis:
Support: $58.46 (recent low, indicating buyers stepping in).
Resistance: $60.01 and $60.88 (near-term targets and resistance zones).
Volume: Moderate at 20.856K, indicating steady market activity.
Strategy for Long Position:
Entry Point: Consider entering around the current price ($58.89) if there is confirmation of support at $58.46 holding.
Stop Loss: Place a stop loss just below $58.46 to limit downside risk.
Take Profit Targets:
First Target: $60.01 (EMA 30 resistance level).
Second Target: $60.88 (EMA 60 resistance level).
Risk-Reward Ratio: Ensure a minimum risk-reward ratio of 1:2 for this trade.
Confirmation: Look for:
Increased buying volume at the current level.
Bullish candlestick patterns or a crossover of EMA (10) over EMA (30).

ZEC USDT Spot trade | 2000% or ATH Potential in 2025 Bull MarketZEC/USDT is showing potential for a 2000% rally or reaching its ATH in the 2025 bull market. Zcash, known for its strong privacy features, could see a boost in demand as market conditions turn bullish. Technically, watch for ZEC breaking key resistance levels and holding above long-term support zones for confirmation of the trend reversal. 📈 #ZEC #Crypto #ATH"
Buy in dip and hold in spot

#ZEC/USDT#ZEC
The price is moving in a descending channel on a 3-day frame and is sticking to it well
We have a bounce from the lower limit of the descending channel and we are now touching this support at a price of 24
We have a downtrend on the RSI indicator that is about to be broken, which supports the rise
We have a trend to stabilize above the moving average 100
Entry price 31
First target 43
Second target 56
Third target 73

Keep an eye on #ZEC/USDT Diagonal Trendline in 1-Hour TF!Keep an eye on #ZEC/USDT Diagonal Trendline in 1-Hour TF!
Wait for BO/retest to long. The local resistance level is PDH $74.64 and the support level is PDL $68.34.

ZECUSDTKey Level Zone : 66.11-68.53
HMT v1.0 detected. The setup looks promising, supported by a previous upward/downward trend with increasing volume and momentum, presenting an excellent reward-to-risk opportunity.
HMT (High Momentum Trending):
HMT is based on trend, momentum, volume, and market structure across multiple timeframes. It highlights setups with strong potential for upward movement and higher rewards.
Whenever I spot a signal for my own trading, I’ll share it. Please note that conducting a comprehensive analysis on a single timeframe chart can be quite challenging and sometimes confusing. I appreciate your understanding of the effort involved.
If you find this signal/analysis meaningful, kindly like and share it.
Thank you for your support~
Sharing this with love!

Wave structure of ZEC coin in day time frame- DAY is swing bullish=> current is pullback
- 4H is swing bearish => current is pullback
The daily time frame is in an uptrend. The 4-hour time frame is in a downtrend. Therefore, we can buy when the price reaches the demand zone of the daily time frame or at the 4-hour time frame for a bullish reversal signal.

ZECUSDTHMT v1.0 spotted. Looking good with previous wave up with increasing volume and momentum.
- BOS (Breaks of Structure) at @ 55.71-57.16 level
- Trending slow and steady if able to hold above the BOS level
It is at extremely good reward to risk level.

Bull or Bear we have it allMarket does get down more than it goes up. This cycle of supply, demand, accumulation, distribution is a never ending cycle.
As we see the ZEC chart we can see buy and sell points. Use BTC downtrend and Sell prints for shorting. Use good leverage
D Y O R
For indicator access, you can message me.

ZEC off-leashZEC saw tremendous volume the whole year, lots of interest.
IMO those buyers wont just sit on it, true uptrend will come, aswell the ZEC ETF from Grayscale played a big role into the buying spree.
Here is a shortterm goal i could see, all details in the chart.
trade safe

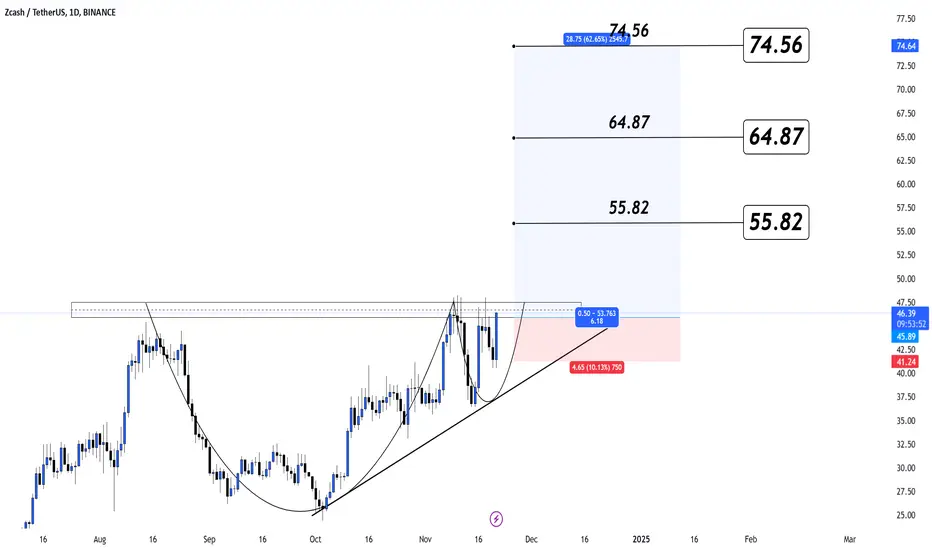
It's time for $ZEC to switch bullis💰 #ZEC / USDT
It's time for SEED_DONKEYDAN_MARKET_CAP:ZEC to switch bullish🐃
We got an accumulation at the bottom of a big ascending channel, now looking for a break through the resistance confluence of Superguppy + Key Zone and rise🚀
RSI is getting BULL as well👀
✔️1Tp: 55.82$
✔️2Tp: 64.87$
✔️3Tp: 74.56$
Zcash near resistance - breakout or down?Hello, fellow traders!
This is my analysis on Zcash (ZECUSDT).
1️⃣ Analysis
We see the price slightly above the resistance line of the weekly regression channel. With the strong bullish movements of crypto and stock markets fueled by the outcome of the election, it has shown an aggressive uptrend yesterday.
2️⃣ Expectations
We might see a consolidation (orange path) very soon and we can imagine two different scenarios after it - even more aggressive uptrend or downtrend.
3️⃣ Key approach
Our first strategy would be entering short. If we confirm a lower breakout after the consolidation, we will view that as price respecting the current trend. We will then enter short, 30.84 being our final target. We then might see another consolidation between the regression line (dotted red line) and the support line (green line).
4️⃣ Other approach
Our second strategy would be entering long. If we confirm a upper breakout instead, we might consider a possibility of stronger, more aggressive uptrend. However, keep in mind there's a major resistance at 49.44, making this approach more unlikely.
5️⃣ Considerations
There are currently no news about Zcash that might affect the price movements. The interest rate announcement this Thursday might affect the crypto market positively. However, with major resistance being right above the resistance line, price is most likely to respect the current trend. If not, I will update the post accordingly.
React, don't predict! Stay disciplined and patient. Don't get greedy and be thankful.
Ephesians 5:8-10
(You might have noticed that I changed my chart settings - am trying to stay organized and consistent with my posts from now haha)
