ZEC moment to shineKeep it simple! According to the chart, my estimate is to hit the zone in early Feb 2024
Estimate rebound 6x from here > $120 zone
My average entry is $19.7
I think this is the bottom for it in this cycle, next is rebound then the correction zone then bull run.
Disclaimer: I could be wrong, don't invest what you can't handle to lose. Manage your risks.
ZECUSDT trade ideas

Buy Trade ZEC: Leveraging Privacy Features in CryptoDescrizione:
This trading idea is focused on ZEC (Zcash), a cryptocurrency that stands out for its strong privacy features. ZEC uses advanced cryptography, specifically zero-knowledge proofs, to offer users the ability to conduct transactions with enhanced privacy compared to many other cryptocurrencies. As privacy becomes an increasing concern in the digital world, ZEC’s unique position in this niche makes it a valuable asset for those interested in protecting financial anonymity.
However, the cryptocurrency market is subject to high volatility, and ZEC’s price can be influenced by factors such as regulatory scrutiny and market sentiment. With privacy coins facing potential regulatory challenges, investors should be mindful of these risks while considering the opportunities ZEC provides.
Disclaimer:
This trading idea is for educational purposes only and should not be interpreted as financial advice. Cryptocurrencies, including ZEC, carry significant risk and can result in the loss of your entire investment. Always conduct your own research, consider your financial situation, and consult a financial advisor before making any investment decisions. Past performance is not indicative of future results.

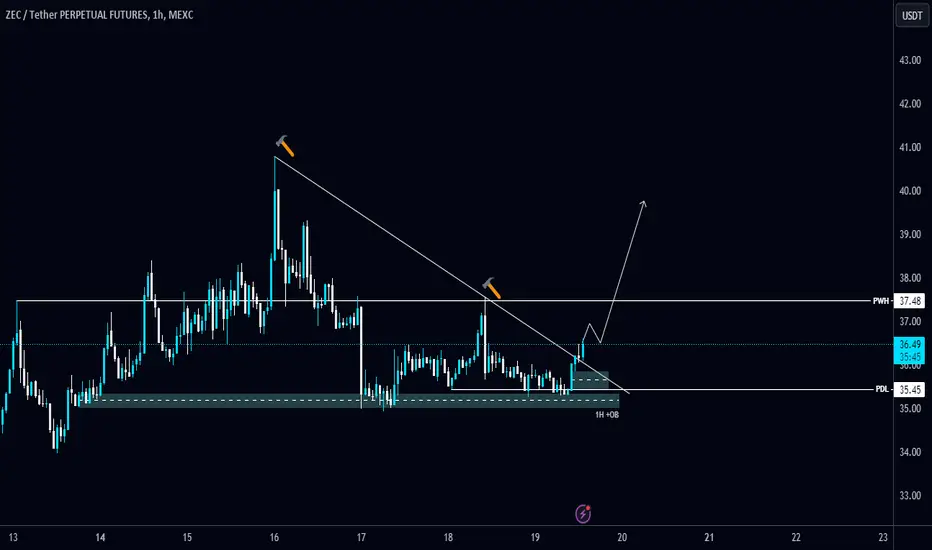
#ZEC/USDT breaks the Diagonal Trendline in 1-Hour TF!#ZEC/USDT breaks the Diagonal Trendline in 1-Hour TF!
Looking good for a long position. The local resistance level is PWH $37.48 and the support level is PDL $35.45.
ZEC Day tradeUse this ZEC setup for your trade
It look nice to buy in that area
Follow for more market update and trade setup


Ancient coin. Good opportunityPOLONIEX:ZECUSDT After break down below weekly support it's went up and tested the weekly support zone for confirmation. Now is a good to time to take a chance.

ZEC/USDT 1D Zcash is a chart I like the look of quite a lot on the 1D timeframe. ZEC has outperformed the majority of the altcoin market since it flipped the 1D 200EMA downtrend into an uptrend.
The 1D 200EMA has been I a downtrend for 2.5 years since the very beginning of 2022! Since then ZEC has bounded off the moving average once with a large wick and now it has just swept liquidity and reclaimed. Waiting for a confirmation of support with some clear closes above. The local double bottom can be seen using the 0.25 line as support. The next resistance level is the 0.5 range midpoint should the 1D 200EMA close above with strength.
It's important to realise that ZEC is still -92% from its $371 ATH, so it has huge room to grow once price has broken the more local range (1.0 level). If the last few months are an indication of the kind of support it has then it's a very good sign IMO. The local range that is

ZECUSDTI'm anticipating a downward move in ZECUSDT, signaling a potential short opportunity. The market conditions suggest weakness, and this trade aims to capitalize on that downside momentum. Entry, Stop Loss, and Take Profit levels are set and visible on the chart to manage risk and secure gains efficiently. This short position is designed to take advantage of the current bearish trend, while maintaining a balanced risk-to-reward strategy.

Bearish Head & Shoulders on ZECBearish head and shoulders idea on ZEC
Idea's confirmation: below $24.4
Idea's cancellation: above $32.5

ZEC, shifting after 2.5 years! massive price growth ahead!After peaking at a parabolic price of 300, ZECASH has been on a weighty downtrend for eons -- trimming down it's valuation every single month and coming back to ground to almost 10x from its peak.
Now, based on recent long term data metrics, ZEC is finally shifting massively after 2.5 years! That's a long wait! This shift is massive -- it's happening for a good reason.
As seen on diagram, we are seeing a bear clearance based on long term metrics. Bear dissolvement has been spotted this month, August -- for the first time in ages.
Net buying activity has surge exponentially from the current range signifying renewed interest, and buyers positioning on the enormous growth prospect of the coin.
The RR ratio of ZEC is too attractive to be missed at 8-10x.
The current bargain range is an ideal seeding area.
One of the few coins which boast a juicy RR from this corrective season.
Spotted at 40.0
Interim target at 120.0
Long term at 300.
TAYOR.

ZECUSDTThe rising swing trade volumes indicate heightened market activity, while algorithmic analysis signals the potential onset of a bearish trend.

Zecusdt Swing LongAdded to swing long under 28.85 stops at clean breaking below 28.
Holding here can trigger a huge fast move.
Tp 60+
Note: Not a Financial

Zecusdt trading opportunityZECUSDT has shown a bullish divergence, indicating potential upward momentum. The major demand zone remains a critical support area to monitor for immediate buying opportunities. Increased volatility is expected if the price breaks above the immediate resistance level. The projected target is towards the significant supply zone, suggesting substantial potential gains.

ZECASH long setup / 1:1 SettingBINANCE:ZECUSDT
COINBASE:ZECUSD
Hello Traders
💥Long position on ZECASH
SL1 ---> Low-risk status: 3x-4x Leverage
SL2 ---> Mid-risk status: 5x-8x Leverage
👾The setup is active but expect the uncertain phase as well.
➡️Entry Area:
Yellow zone
⚡️TP:
32.35
🔴SL:
30.32
32.75
33.45
🧐The Alternate scenario:
If the price stabilizes below the trigger zone, the setup will be cancelled.

bounce zecintraweek punt, h4 tf and inside price objective or underside retest of that box
strong selling after hitting $40+ and looking like a deviation of $35.00 level back down to $25

Zcash To $955 (3,264%)? Grew 2105% In 2021 (Market Psychology)My biggest mistake has always been aiming too low rather than too high, this time I am going to err on the high side.
Zcash looks great on its Tether (USDT) pairing, specially when we compare it to the Bitcoin pair (ZECBTC), but, a new All-Time Low has been hit recently.
The low hit in July 2024 went lower than March 2020 but technically speaking, we have a long-term double-bottom. Unless we have a repeat of early 2020 and the current correction now leads to a lower low compared to July 2024 rather than remain a higher low —this would be followed by a swift recovery. If something like this were to happen, this wouldn't change our long-term price projection nor the fact that we will have a major bull-market in 2025. So it would only be a temporary sell-off (panic).
Zcash grew more than 2,100% in 2021.
The accumulation phase between 2023 and 2024 lasted 392 days, which is pretty good by any standard and can support major growth.
Uncertainty is only present around September 2024, now! This is because we know Bitcoin is going to crash and the Crypto-giants as well; Binance Coin, Toncoin, XRP, Dogecoin, Tron, Solana, and all those big Altcoins that have not completed their correction. This will definitely affect the rest of the market.
The initial effect of a major Bitcoin crash, the continuation of the bearish wave that started March 2024, would definitely affect the entire market strongly but most of the Altcoins would recover within days. Some are able to "detach" from Bitcoin and even grow.
For ZECUSDT, which is the pair we are looking at now, a higher low vs July 2024 would be the norm based on the long accumulation phase with its high volume but this can easily break. Prices can move lower, on-purpose, in order to liquidate leveraged traders. This way the exchanges can collect all the collateral before major growth.
Higher low or lower low does not change what we are looking at, the 2025 bull-market.
ZECUSDT will grow and it will grow massively. The technical double-bottom makes 735% ($237) an easy target. If all goes well, as we expect based on all the capital that will be flowing into Crypto in 2025, Zcash can reach new All-Time Highs. The first target is set at $598 for 2,000% potential profits. And the last and major ATH projection stands at $955 for a massive 3,264% growth potential.
Just one last period of uncertainty, or bearish action, and we are done. After Bitcoin's correction is over, we can focus on, and enjoy, marketwide sustained long-term growth.
It will be beautiful... If you are reading this now, you have great timing, amazing timing and you are ahead of the pack. You are early and early is great because you have enough time to calculate, plan and prepare.
Our strategy is very simple: Buy and hold.
We are now in accumulation mode.
We intend, according to our own financial capacity, to buy, buy, buy, buy, buy and buy some more, at every chance the market gives. If prices drop, buy more. If prices move up, buy more, and focus on the long-term.
When prices are high-up and green, when people start talking about forever more, greed and ZEC to 3K, that's the time to sell.
When euphoria sets in and people lose all sense of sanity and everything is green and new All-Time Highs are present all across, that's the best time to take profits because it means we reached the top.
When there is fear, uncertainty, doubt, disinterest and the entire market is red, that's the time to buy and hold focusing on the long-term; because the bottom is in or close.
It works in reverse, you see, the market psychology.
➖ The market impulse will tell you to buy at the top. It is not really telling you to buy, the impulse happens because everybody is bullish and actual growth is happening. That's what we read subconsciously as a buy signal. Since beginners have no way to gauge the current market situation, they interpret this impulse/feeling as a buy signal and buy at the top. Sure enough, the crash happens just right after. Think of early 2024. Many people rushed to buy in. People told me it was the "start of the bull-market" while I was warning of an impending correction and everything is down now by 80-90%.
➖ The market impulse will tell you to sell at the bottom, when the market is depressed, why? Everything is negative, news are negative, the mood is down, there is no excitement, all the bots, whales and exchanges are selling... As you approach the market, your subconscious mind receives these signals and interpret them as a sell signal. It is not a sell signal, it only means that it is what is actually happening. But as a trader, someone smart, with vision, you know the best time to buy is when prices are low. So you have to go against this feeling, you have to go beyond the market sentiment, get the bottom, buy now, hold long-term and prepare for growth.
The Altcoins are down now, full red and these can be accumulated thinking of the long-term.
Some are yet to crash, from these, stay way.
Consider the ones trading very low or near support.
The rest requires patience and better prices will definitely show up.
After the crash, everything grows.
Namaste.

Long ZECIdea:
- Bullish DIV
- liquidation wick taking out the longs
- swing point
- close above the the previous lows
Entry:
- Enter from 50% retracement to GP, comes out to 50-75% of the liquidation wick
- One Entry: Lower time frame bullish divergences
- DCA: 50% and GP levels
High conviction, low risk
DCA is better entry option

ZECUSDT Potentially BearishHi there,
ZECUSDT looks bearish on the daily chart, with 39.53 being the nearest support level that will be tested in lower time frames. The bias is 25.09, with two price targets.
Keep in mind that the price is attracted to the 44 area, as the market is currently ranging between lows and highs.
Happy Trading,
K.


Zcash Eyes $80-$100 as Bullish Momentum Builds!Welcome to another analysis where we take a look at Zcash!
Zcash is a well-established cryptocurrency with significant potential for future growth!
Recent market activity shows increasing volume for Zcash, including a notable volume spike that pushed its price above the previous high, indicating a potential market shift. Additionally, the 20-day moving average (MA) is approaching a bullish crossover with the 50-day MA, further suggesting a positive trend.
In my assessment, the Zcash chart is currently very promising. For those considering an entry, a strategic buying range would be between $28 and $31, aligning with the 50/20 MA levels.
Historically, Zcash reached a peak of $700 in January 2018. While that level might be ambitious in the short term, a more attainable target for intraday trades would be the $50 range, with a potential upside to $80-$100 where we see a decending trendline from 2021 and more strong ressistance.
The current setup offers a favorable risk/reward profile, with stop-loss levels recommended below the previous low, around $20-$25, depending on your risk tolerance.
Zcash's breakout coincides with BTC dominance encountering strong resistance, and the increasing strength of various altcoins. Additionally, the Russell 2000 index is nearing a breakout, showing investor appetite for smaller-cap stocks and riskier assets.
Thanks for reading and good luck with your trading!
Make sure to follow me on X for more weekly updates: @PuppyNakamoto
BINANCE:ZECUSDT COINBASE:ZECUSD KRAKEN:ZECUSD GEMINI:ZECUSD

i mean... would it?would like to scale in and anticipate a dip. CRYPTOCAP:BTC seems overextended anyway

ZECUSDT.1DThe chart you've shared for ZEC/USDT on the daily timeframe provides a clear view of Zcash's recent market dynamics, including support and resistance levels, along with technical indicators such as the MACD and RSI. Here’s my personal analysis based on the chart details:
Current Situation
Price Level: Zcash is currently trading at $43.98.
Recent Price Action: The price has shown a noticeable uptrend recently, indicating a resurgence of buying interest.
Support and Resistance Levels
Resistance Level (R1): $51.95
Support Levels (S1 and S2):
S1: $31.20
S2: $15.70
Technical Indicators
MACD: The MACD indicator shows a positive divergence above the signal line, which suggests growing bullish momentum. This could indicate potential for continued upward movement if the trend persists.
RSI: The Relative Strength Index is at 62.39, which is moderately high but still below the typical overbought threshold of 70. This suggests that while there’s buying momentum, there isn’t immediate pressure from an overbought condition.
Analysis and Conclusion
From my perspective, Zcash is currently in a bullish phase, as indicated by both price action and technical indicators. The break above the previous consolidation zone suggests strong buyer presence. However, the upcoming resistance at $51.95 could pose a significant challenge.
Trading Strategy
Bullish Scenario: If Zcash continues to maintain its upward momentum and successfully breaches the resistance at $51.95, it could potentially explore higher price levels. It would be wise to watch for a sustained volume increase as a confirmation of continued bullish sentiment.
Bearish Scenario: On the flip side, if Zcash encounters strong selling pressure near $51.95 and reverses, the price might retreat to test the support at $31.20. A break below this could lead to a further drop towards $15.70, especially if accompanied by high selling volume.
Final Thoughts
Investors and traders should closely monitor how Zcash interacts with the $51.95 resistance level. A proactive approach would involve setting stop-loss orders slightly below key support levels to manage risks effectively. Additionally, it’s crucial to stay updated on broader market trends and news that could impact Zcash’s price dynamics. Always ensure your trading decisions align with your risk tolerance and investment strategy.

HOLD ONTO YOUR TIDDAYS BOIS ZEC TO THE MOONAfter enduring a prolonged recession, it's finally time to look up and see the light on the horizon. ZEC/Zcash is about to skyrocket—prepare for a monumental ascent. Hold onto your tiddays because we're going to the MOOOON.
