Rescue ZECusdtLonging Zecusdt one last time.
Rejection needed.
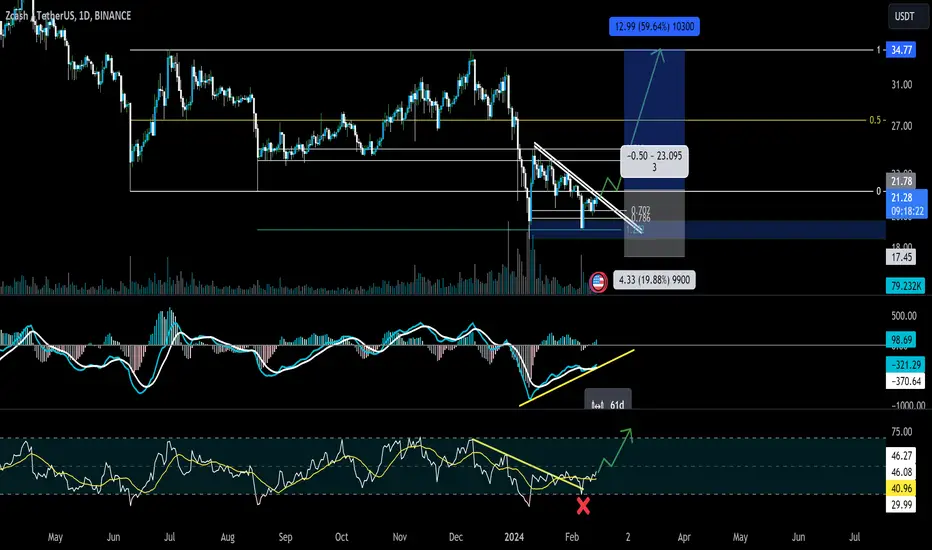
Entered into long 21.03
Flat Stoploss at 20.70
Will close if holds below 21.85.
Targeting 24 and 28.
Note: Not a Financial Advice.
ZECUSDT trade ideas

ZECUSDT.PHM signal v3.0 (High momentum) spotted. Looking good with previous wave up with increasing volume and momentum.
- Heathy retracement and support well at good level @ 26.40-26.83
- Trending slow and steady if able to hold above the support zone
It is at extremely good reward to risk level now if able to hold above the support level.


ZECUSDT 3D#ZEC is another 4x~5x coin in my list. Currently it is facing heavy resistance which is MA50 + MA100 on 3-days timeframe + falling wedge resistance. In case of breakout, massive bullish wave will come. Keep an eye on it.👀
🛡Main support is around $18.50
🎯Targets are:
$56.19 $79.51 $98.35 and $117.19

ZEC LMMFAO THIS COIN ALWAYS DISAPOINTS BUT WE BALLZcash is a privacy-focused cryptocurrency which is based on Bitcoin's codebase. It shares many similarities, such as a fixed total supply of 21 million unitsZcash is a privacy-focused cryptocurrency which is based on Bitcoin's codebase. It shares many similarities, such as a fixed total supply of 21 million units

$ZEC LongThe important price area is mentioned the video guys, do have a look. This is is an important video idea for a potential Long, find your edge and then act thats all we need to do. Like and comment if you found this helpful.

ZEC Possible Long Opportunity ZEC Possible Scenario.
Breakout of trendline
Breakout of MA
Bullish divergence.
After Retest of trendline I will Enter to the Moon 🌙

#ZECUSDT 3R/R POTENTIAL !#ZECUSDT is on the verge of a nice breakout into the range high
RSI downtrend broken while price held support after the last leg down.
Confirmation would be price breaking back into range while the daily RSI breaks the 50% level and tests it as support.
DWEB SpyOPS indicator used for Gann and trend tools.By turning on different elements of the indicator, you get see how the trends project some nice short term trends. I have shown one of the biggest use cases on how to use DWEB via the trend nodes. These are great for just about any drawing, geometric, Gann or Fib tool.
See Below

Short trade Bitget
Pair: ZECUSDPERP
25TH Jan 24
5min TF
Top of range
18.30pm
24th Jan 24
Entry 22.34
Profit Level 21.73 (61PIPS) 2.73%
Stop level 22.53 (19PIPS) 0.85%
RR 3.21
www.tradingview.com

ZECUSDT PO3 (accumulation)Zec looks like were in accumulation zone as per wycoff schematic and currently in shakeout area preparing for back up and expansion.
Current zone is risky for entry but if you decided to enter here just manage your SL.
My entry zone once zec back up and close above 21.70 in daily TF will try to take the retest (LPS).


🚀🚀300% flight in 2024. Binance will not delist ZEC.🚀🚀 I think soon the exchange will start listing this coin back. Now very good entry for hodl. We Have 1-2 wave and soon will up


$ZEC 618 ReturnLooking for an eventual run to the 618 here on ZEC which is also the measured move of the broadening bottom. Each checkmark along the side is likely going to act as short term resistance, the first being a critical support flip.
The second, is the top of the range created with the broadening bottom / downsloping accumulation. To expect a continuation from there, youll likely see a partial decline, and a breakout on the second attempt.
The 50% retracement zone there is the original extension level i wouldve targeted at 87, but could reach as high as 97, if you factor in the recent spring event.
Levels will be easier to dial in after the first real move away from this level following a proper checkback, and would be calculated with a simple 1.618 extension of the first completed wave up.

Potential ZEC LONGZEC Long entry: 23.28 - 23
LEV: 10x - 20x
TP: 25.90
Stoploss: 22.90
Not a financial advice

FUD on Privacy Coins: MEGA PUMP ZEC comingThey are preparing us for a mega pump for ZEC based on the latest FUD news of delisting due to regulatory issues.
Sell Zone: 99$
I got 99 problems, but Zcash ain't one
Discilmar:
Manage your own risk don't go heavy.
Spread your risk, don't put all your eggs in one basket.

ZECUSDT.PZECUSDT.P is in bearish trend but strong sign of trend reversal here.
Bullish divergence form in RSI.
Bullish falling wedge reversal pattern also form .
We wait and watch for the breakout of wedge pattern and last LH.


Huge upside potential for Zcash. Next 20x Coin?Zcash is currently sitting at yearly resistance. It has huge updside potential as it 99% down from ATH. Secondly Greyscale has applied for ZEC ETF. If it gets approved it has even higher upside potential. However, this is a risky trade as it may be delisted from Binance and some major exchanges. Keep Stop loss at 17/

Zcash is going to be huge? :oWe have bottomed or pretty close. I think OG monetary coins are going to pump like we have never seen before! Time will tell. Prediction is 3k per coin Q1-Q2 2025.

Long idea on ZEC (experimental)This coin is holding a fairly strong down trend and so far the majority of shorts are here. But what will it lead to? (look at bitcoin), secondly, I'm counting on a mini-alt season that will allow this old man to grow. I can close the position as soon as I deem it necessary
