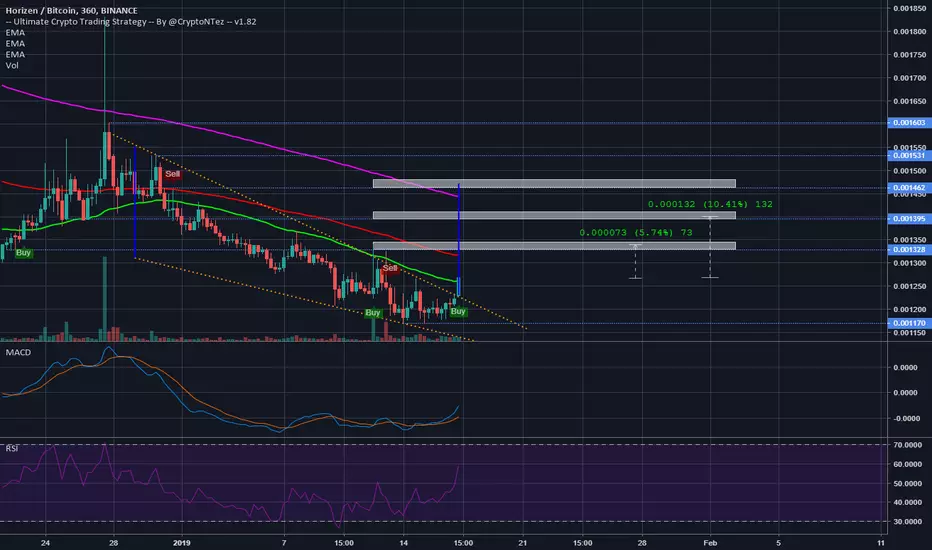
ZEN-BTC Long Trade PlanHORIZEN LONG TRADE
Chart is self-explanatory, I think.
Greens - Targets
Blue - Buy Zone
Red - Stop Loss
ZENBTC trade ideas


#ZEN long waited - reversal?ZEN is inside a falling wedge, though it doesn't invalidate this trade as I think this is the reversal for a start of uptrend, low circulation supply and low cap how it is I wouldn't be surprised to see it fly. The 200 EMA is above our final target.
Long waited to see ZEN reach this box and good news is the hidden bullish divergence on the daily chart.
If you want to play safe, wait for the break of the falling wedge.
Enjoy !

zenbtcWhen we examine the graph, we can see 3 positive divegence. so the rise can be expected. Considering that there are positive rises in the market now, this coin will rise soon. I showed my goals..

Breaking up from a Falling wedge!$ZEN Looks like a falling wedge that is breaking up, Volume is kinda low yet, but MACD looks bullish, RSI around 55¬ and going up. Buy signal from the UCTS. I have drew potential targets in the chart. Also falling below the current breakup will cancel the trade. #ZEN #horizen


ZENBTC Scalp LongA test of the newest Wave-PM CCI tool. Pretty darn accurate so far.
This is a bet against the current trend so it should be considered high risk. Price will either go sideways or back up to the 50 mean period once it moves back into the 50 4H band.
Set a CCI crossing up alert using 50 CCI.
Current target: 0.001429
Use a 2-3% SL
NOTE: The longer this takes the lower the target, please adjust accordingly to the 4H 50MA

ZENBTC a buying opportunity for profitThe formation of gartley is in process the B to C leg will be started from this buying area insha Allah.
Regards,
Atif Akbar

New horiZENs
My favourite coin is reversing. Could it be the bottom or just a reaction for the overall market situation, I don't know. But if it is, it promis some good profits. And I've marked only those that comes in the nearest future. ZEN weekly chart from Bittrex shows it has much more potential.

Daily Bullish Signal $ZEN #ZEN ZEN/BTC (11 November)BLUE ARROW indicates EXPECTED Time and Targets
Contact me if you need help


ZEN (ZenCash now Horizon) short term analysis As usual, coffee, work procrastination and obsession has developed this chart. Want more explanation? Comment and I'd be happy to start babbling.


ZEN/BTC - Time to Buy - 100% - 150% profitCoin ~ Horizen
Exchange : Bittrex/Binance
BUY : around 200k - 205k
SELL : 220k - 240k - 300k - 380k - 520k - OPEN TARGET
Stop loss: 178k

ZEN/BTCRisk : High
Coin: ZEN/BTC
Exchange: Binance
Entry Zone: 0.00242 or under
Target 1 : 0.00264 (10%)
Target 2 : 0.00288 (20%)
Target 3 : 0.00324 (35%)
Stop Loss: 0.0023 (4%)
Comment : Break a long downtrend
RSI Bullish

[ZENBTC] Horizen Secure Nodes LONG [150% – 250% PP]The charts for ZEN are looking good for a long term trade, so let’s take a look and get started right away:
Trade instructions for Alan Masters Trades PREMIUM Supporters
Buy in: 0.00240 – 0.00254
Targets LONG TERM for Horizen (ZENBTC) by Alan Masters:
(1) 0.00292
(2) 0.00328
(3) 0.00388
(4) 0.00184
(5) 0.00553
(6) 0.00641 (All time high)
(7) 0.00737
(8) 0.00893
Capital allocation: <10%.
Notes:
- Horizen (ZEN) has a variation to masternodes called secured nodes, which improve on security and privacy according to them.
- This is a strong altcoin and can be held long term. Is it in the Top 100 altcoins by marketcap list.
- You can research these to set up a secure node and earn passive income.
- You can earn long term through your nodes and later sell for profits when ZENBTC hits the price you are confortable selling at.
- Masternodes / Secure nodes are meant mainly for long term passive income generation.
Stop loss: Close below 0.00230 on the weekly candle.
If you buy into this trade and decide run a secure node at the same time, you can ignore the stop loss and hold Horizen (ZEN) long term. Only sell when you meet your desired price. This type of strategy is only possible with a bullish view of altcoins and cryptocurrency in general in the long term. We believe that cryptocurrency is here to stay and that it will be used as the money of the future.
Namaste.

ZenCash Critical Point : Waiting For ConfirmationSince its listing on Binance ZenCash has showed a fair performance recording its lowest at 2528 sats on the platform. If a double bottom is confirmed on the 1D chart we might see a good leg up trend move with a continuation of the 3rd elliott wave rally. RSI looking good at 48. Volume need to increase some move upwards. As it is described if the candle close above that point on the intersection we will have confirmation. For now accumulate with a small amount of your portfolio And do consider to use a strict stop loss orders after accumulating and before that accumulate using risk management and partial buy orders.
Entry Zone : 300000 sats - 333000 sats
Stop Loss : 258000 sats
Possible Targets
Short Term :
T1 : 341200 sats
T2 : 363700 sats
T3 : 378300 sats
T4 : 394900 sats
T5 : 418500 sats+
Mid / Long Term
T1 : 364800 sats
T2 : 39900 sats
T3 : 433900 sats
T4 : 482000 sats
T5 : 544000 sats
Good Luck.
Legal disclaimer:
Information on this channel is our team's analyst's "opinion" based on data available at this point in time. These opinions are not recommendations to buy or sell securities/commodities and cryptocurrencies. Trading and investing is a risk and you should not rely on this data to make any financial decisions. You must consult a financial advisory licensed by regulatory agencies in your legal jurisdiction. All information stated here and in our reports don't guarantee any possible profits or losses. Please do consider to do your own due diligence and research when making any kind of a transaction with financial implications.
With Regards. TeamTWA.
Stay tuned to our channels to get more updates. Don't forget to give a like if you agreed with this idea. or put your comments below if you disagree on it.
You can also follow our telegram channel for more news, TA, FA, and trading tutorials. With Regards.

ZEN Looking BearishPotential H&S setup
If BTC's bear flag confirms, we should see some further downside
If it we get a bear break .0029 would be a solid support
