Altcoin Spotlight ( ZEN ) !🔍 Altcoin Spotlight: Why ZEN Might Be One of the Best Buys Right Now
Hello Traders 🐺
One of the high-potential coins I’m watching closely for the upcoming Altcoin Season is Horizen ZEN — and here’s why:
⚡ Technical + Fundamental Confluence
A few months ago, ZEN printed massive green candles, gaining over +200% in a single month. This level of volatility and strength suggests the coin is capable of explosive upside when conditions are right.
Right now, ZEN is trading near a key monthly demand zone, which has previously acted as a strong base for major rallies — a solid long-term entry point in my view.
We’re also seeing price coiling beneath a descending trendline. A breakout above this level could trigger the next leg up — potentially toward the $40+ zone, a key historical resistance.
Don’t forget: ZEN halved last year, reducing supply and increasing scarcity — a fundamental catalyst that could fuel the next price run.
🧭 What's Next?
This is just a quick long-term update. I'm planning to gradually share my personal holding portfolio with you during this cycle. So if you're serious about positioning for Altseason, follow me to get notified about the daily drops in this new content series.
I’ll continue to post both routine market ideas and my favorite Altcoin picks — this is the beginning of something exciting 🚀
—
🐺 Discipline is rarely enjoyable, but almost always profitable. 🐺
🐺 KIU_COIN 🐺
ZENUSDT.P trade ideas

ZEN/USDT Weekly Analysis: Major Accumulation Zone
🧠 Chart Analysis Overview (ZEN/USDT - 1W):
This weekly chart of Horizen (ZEN) against Tether (USDT) reveals a long-standing accumulation zone, and current price action hints at a possible bullish reversal from a critical support level. Let's break it down:
🟨 Key Technical Zone:
Support Zone (Accumulation): $5.06 – $7.06
This zone has acted as a major historical support area dating back to early 2021. Price has tested this zone multiple times and shown rejection, indicating strong buyer interest.
🔼 Bullish Scenario:
1. Price Rejection from Support:
A strong bullish wick and potential bounce from the $7.06 area signals accumulation and possible reversal.
2. Upside Targets (Resistance Levels):
$10.55
$14.71
$20.51
$30.08
$49.78
Long-Term Targets: $108.12, $144.81, $169.23
3. Pattern Indication:
The price action resembles a triple bottom formation within the accumulation zone — a classic reversal pattern. The yellow projection shows a possible V-shape recovery or rounded bottom scenario.
4. Trigger Confirmation:
A weekly close above $10.55 would be a confirmation trigger for continuation toward the next resistance levels.
🔽 Bearish Scenario:
1. Failure to Hold Support:
If ZEN fails to hold the $7.06 support zone and closes below the historical low of $5.06, the bullish structure invalidates.
2. Downside Risk:
Below $5.06, there's no significant historical support, suggesting a sharp drop is possible — potentially entering uncharted territory.
3. Bearish Breakdown Trigger:
Watch for weekly candle body close below $5.06 with volume — this could initiate further downside pressure.
📐 Pattern Summary:
Pattern Forming: Triple Bottom / Accumulation Zone
Type: Reversal Pattern
Timeframe Validity: Weekly – suitable for mid-long-term swing outlook
Volume Context: Not visible in chart, but confirmation from volume would strengthen the setup
🎯 Strategic Outlook:
Bias: Neutral-to-Bullish (While above $7.06)
Ideal Entry: Around $7.00 with tight invalidation below $5.00
Invalidation Level: Weekly close < $5.06
Take-Profit Zones: $10.55 → $14.71 → $20.51 → $30.08 → $49.78
#ZENUSDT #Horizen #CryptoReversal #AltcoinAnalysis #TripleBottom #TechnicalAnalysis #AccumulationZone #CryptoSwingTrade #SupportAndResistance #BullishSetup

ZENUSDT Forming Bullish SwingZENUSDT is attracting a growing number of traders who are paying close attention to promising altcoins that could deliver solid gains in the coming weeks. Horizen (ZEN) continues to prove its resilience in the privacy and blockchain interoperability space, and the recent price action hints at a potential reversal from a strong support zone. With good volume building up and a stable base forming, many investors see this as a strategic accumulation level for the next bullish swing.
Horizen’s fundamental strength lies in its privacy features, sidechain solutions, and robust community backing. As blockchain adoption expands, projects with practical use cases like ZEN gain renewed interest, especially from long-term holders looking for coins with sustainable ecosystems. The expectation of a 50% to 60% gain aligns well with the current market structure, where we see buyers stepping in around the highlighted demand zone to push prices higher.
From a technical perspective, the recent chart shows that ZENUSDT is consolidating within a clear support area while maintaining good volume. This suggests that a breakout could be imminent if the price can close above nearby resistance levels. The next leg up could see ZEN retesting previous highs, providing attractive short-term opportunities for swing traders and position holders who are looking for coins with strong fundamentals and momentum potential.
✅ Show your support by hitting the like button and
✅ Leaving a comment below! (What is You opinion about this Coin)
Your feedback and engagement keep me inspired to share more insightful market analysis with you!

ZENUSDT 1W Analysis ZEN ~ 1W Analysis
#ZEN Buy on retest of this support block with short term target of at least 20%+. This is the lowest support block for now.

ZEN/USDT – 15M Chart Analysis📊 Trend: Bullish
📈 Entry Plan: I will take entry right after a confirmed breakout of the accumulation box.
🎯 Profit Target: You can book profits based on your own risk-reward ratio and trade plan.
"Amateurs focus on rewards. Professionals focus on risk."
Always protect your capital—let the market come to you, not the other way around.

Horizen: What You Need To Know About The Altcoins—Experts Only!A shakeout is a market move where the whales (exchanges) create volatility in order to rattle unprepared traders and investors.
If you use a limit stop-loss and you are clueless, the exchanges and market whales can see your orders and they use this to their advantage. Since they own all of the coins and everything basically, they can move the market. They produce a massive amount of pressure until everybody freaks out.
Those with too much leverage gets their positions liquidated. Everything lost. That's fine, it is their fault for being too greedy. Learn from your mistakes. Take the loss and move on. Nobody to blame. Just a lesson and a learning experience.
Those with a tight stop-loss limit order get to sell at a lower price and secure a small loss, sometimes between 10-30%.
Those patient, @MasterAnanda readers and followers, get to watch from a distance and even buy more when prices are low. No loss.
Let me get back into conspiracy theory mode.
So the market produced a bottom and is set to grow long-term. Very stupid and greedy people start to become very aggressive and decide to buy with 15, 18 and even 20 or more X.
We have no compassion for these people because this obviously greed, too much of it. And of course, this can never work.
The market is like a living being. Like a horse or a camel. It feels it has too much weight on top of it and if it wants to go the long ride, it has to get rid of this weight. The shakeout only lasts a few days but more than 1 billion USD was removed from the market. This is all leverage. This has nothing to do with buyers, investors or spot traders ok?
So these were literally gamblers that lost money. This is not a casino, this is a financial market. Learn to play the game or get REKT.
The way to play is to buy and hold.
The way to play is by participating, being part of the market and accumulating.
Of course, there is nothing wrong with gamblers but if you do gamble, there is a very strong risk involved.
While a gambler can lose everything in one single bet. A spot trader can hold and if prices drop, simply wait. The worst case scenario ends up being a long wait.
It is a shakeout and look at this chart, ZENUSDT. Two days later, the market is back up—full green. We have a higher low.
This is only the start. It will get harder and more complex as the bull market develops.
Please, whatever you do, do not use margin or leverage if you don't know what you are doing, the results is never anything good.
The only reason why you would use leverage is "to earn more money." "To earn more," "to earn fast." How did that go?
In the quest for fast money, big money, you ended losing hundreds of thousands in less than a month.
It can take 2-3 months to earn a sure 100-300%.
It can take 3 weeks to have your entire position liquidated.
Anyway, stay away from leverage if you can't keep it below 5X.
If you do go there, just know that you will not make it out alive. Everybody is thinking that they can beat the professionals, but the professionals are trading 24-7, you are on a phone and only check-in every few days. By the time you try to adapt, everything is gone. You are not buying from an exchange, you are competing against them and it is a losing game, they hold your money, your history, your data, your coins. They will always beat you because they know everything that you do, and you know nothing about how they work.
They'll give you a great website, lots of numbers, lots of cats and dogs and the illusion that you can make money easily without much effort. You lose money and they make billions.
If you want to win, play long-term.
Only use leverage when you have been successfully trading spot for 2-3 years, minimum. And when you do start with 3X.
By the way, if you don't have time to plan, to read, to prepare, you won't have time to get paid.
This is the most advanced game in the whole world. It is a money game. Only a very small percent are successful at it. Think before you believe you can come ahead without any effort, you are playing against us—we own the market.
Thank you for reading.
Namaste.

ZENUSDT 1D AnalysisZEN ~ 1D Analysis
#ZEN Buy back gradually from here with a short term target of at least 15%+ from here.

ZEN breakout soonYou can either buy gradually from here or wait for a breakout above this resistance line, aiming for a short-term target of at least 10% 20% or more.

ZEN/USDT Daily Chart: Accumulation Before the Big Move? Hey traders! Let’s dive into this daily ZENUSDT chart. Horizon is in a sideways accumulation phase, forming an Expanding Wedge right after a massive bullish Falling Wedge breakout.
We’re also seeing a small inverted head and shoulders at the bottom support range of $7.08-$10.08 , with the neckline at $10.08 . ZEN recently revisited this level, and a confirmed breakout could propel it toward $18.08-$28.94 , with a major target at $41.15 .
If the breakout fails, we might see a pullback to the neckline at $10.08 or the shoulder support at $8.28 .
Key Levels to Watch:
Resistance: $18.08, $28.94, $41.15
Support: $8.28
Breakout Target: $41.15
Breakdown Risk: $8.28
Is ZEN about to skyrocket, or will this breakout fail? Let’s hear your thoughts below!

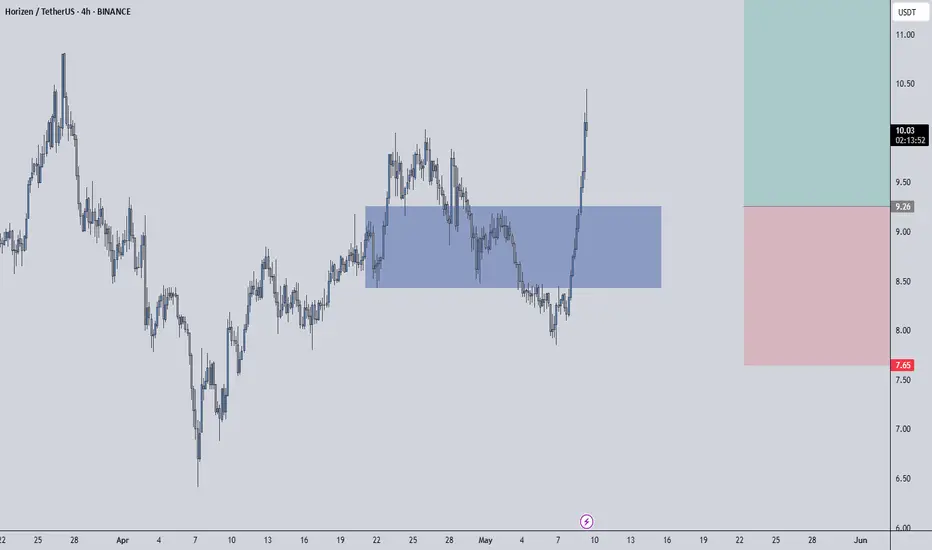
ZENUSDT | Strong Buyers, Strategic PatienceZENUSDT has caught my attention thanks to persistent buyer strength, even in an environment where many altcoins are struggling to hold ground. This tells us something important: smart money is interested, and that makes this chart worth watching closely.
🔹 The Blue Box – A Launchpad or a Trap?
We’re currently testing the blue box, which I believe could act as a high-probability support zone. However, I’m not jumping in blindly. What I’m waiting for is a clear breakout on the 1-hour timeframe — a decisive move that shows buyers are not just present, but in control.
This kind of breakout tells a story: liquidity is being absorbed, and momentum is shifting upward. When this happens at a known zone of interest, especially one where buyers are already active, it opens the door to low-risk, high-reward trades.
🔹 What You Should Watch For:
Breakout from the blue box area on 1H with volume
No strong rejections or fakeouts in the lower time frame
Retest of the box after breakout for safer entries
🧠 Psychological Edge:
Most traders act too early or too late. Waiting for a proper 1H breakout keeps you away from noise and closer to confirmation. This is where many miss out because they are impatient. But remember — our edge comes from discipline, not guessing.
So yes, I’m watching this pair very closely. The buyers are here. The zone is valid. And the plan is clear: wait for the market to tip its hand, then move.
📌I keep my charts clean and simple because I believe clarity leads to better decisions.
📌My approach is built on years of experience and a solid track record. I don’t claim to know it all but I’m confident in my ability to spot high-probability setups.
📌If you would like to learn how to use the heatmap, cumulative volume delta and volume footprint techniques that I use below to determine very accurate demand regions, you can send me a private message. I help anyone who wants it completely free of charge.
🔑I have a long list of my proven technique below:
🎯 ZENUSDT.P: Patience & Profitability | %230 Reaction from the Sniper Entry
🐶 DOGEUSDT.P: Next Move
🎨 RENDERUSDT.P: Opportunity of the Month
💎 ETHUSDT.P: Where to Retrace
🟢 BNBUSDT.P: Potential Surge
📊 BTC Dominance: Reaction Zone
🌊 WAVESUSDT.P: Demand Zone Potential
🟣 UNIUSDT.P: Long-Term Trade
🔵 XRPUSDT.P: Entry Zones
🔗 LINKUSDT.P: Follow The River
📈 BTCUSDT.P: Two Key Demand Zones
🟩 POLUSDT: Bullish Momentum
🌟 PENDLEUSDT.P: Where Opportunity Meets Precision
🔥 BTCUSDT.P: Liquidation of Highly Leveraged Longs
🌊 SOLUSDT.P: SOL's Dip - Your Opportunity
🐸 1000PEPEUSDT.P: Prime Bounce Zone Unlocked
🚀 ETHUSDT.P: Set to Explode - Don't Miss This Game Changer
🤖 IQUSDT: Smart Plan
⚡️ PONDUSDT: A Trade Not Taken Is Better Than a Losing One
💼 STMXUSDT: 2 Buying Areas
🐢 TURBOUSDT: Buy Zones and Buyer Presence
🌍 ICPUSDT.P: Massive Upside Potential | Check the Trade Update For Seeing Results
🟠 IDEXUSDT: Spot Buy Area | %26 Profit if You Trade with MSB
📌 USUALUSDT: Buyers Are Active + %70 Profit in Total
🌟 FORTHUSDT: Sniper Entry +%26 Reaction
🐳 QKCUSDT: Sniper Entry +%57 Reaction
📊 BTC.D: Retest of Key Area Highly Likely
📊 XNOUSDT %80 Reaction with a Simple Blue Box!
📊 BELUSDT Amazing %120 Reaction!
📊 Simple Red Box, Extraordinary Results
I stopped adding to the list because it's kinda tiring to add 5-10 charts in every move but you can check my profile and see that it goes on..
Is Horizen $ZEN The Next Big Crypto Investment Opportunity?In May 2025, LSE:ZEN has reached a strong imbalance trading at $8 after a period of consolidation for a couple of months. A morning star price action candlestick pattern is being created This imbalance suggests that buying pressure is outweighing selling pressure, creating a favorable environment for potential upward momentum.
Horizen is a privacy-focused blockchain platform that combines security, scalability, and decentralization. Built with a strong emphasis on privacy and interoperability, Horizen offers a unique ecosystem that includes sidechains (called ZenApps), a decentralized treasury system, and a robust node network. The native cryptocurrency, LSE:ZEN , powers transactions, staking, and governance within the Horizen ecosystem.

ZENUSDT 1D AnalysisZEN ~ 1D Analysis
#ZEN Buy gradually from here if you still have a Conviction on this coin with a short -term target of at least 15%+ from here.

Horizen: Your Altcoin ChoiceIt is very easy to see where Horizen is going. Very easy. A broadening ascending channel is present on the chart.
➖ Notice the lower boundary and the higher lows. Perfect symmetry. Growing slowly long-term. The bottom was hit June 2023.
➖ Notice the higher boundary and the higher highs. Truly perfect. A new higher high is in place and coming next.
That's it for the char pattern now let's focus on candlestick reading.
There is a strong decline starting in late December 2024. The peak session ended as a shooting star. A classic bearish candle.
The decline is very steep and now is ending as a hammer, another one. This hammer is a perfect reversal signal at this point. The week is yet to close but we know the correction is over because many pairs already moved ahead. What one does, the rest follows.
Trading volume is also really high. Volume is high on the drop and yet the market remained within a long-term higher low. This is a bullish signal. Volume is also high as the action turns to closing green from red.
These are early signals. We are looking at bottom prices, the best possible prices before the start of the next bullish phase.
Zcash and Horizen, both will grow, Bitcoin as well.
This is a great opportunity. A great choice. Your Altcoin Choice.
Thanks a lot for your continued support.
If you enjoy the content or find it useful, consider follow. It will only take a second of your time.
Namaste.

ZEN to start it's next wave up!The beloved coin of no other than the legend Barry Silbert is about to start the next accumulation wave. Will it fully retrace again or is this the start of the next massive rally to new ATH? Time will tell :o)

Another swing for ZEN coming?BYBIT:ZENUSDT.P
Horizen has gained my interest just with looking at the volume etc in the past. Going to wait and see how this reacts.
ill update.

ZENUSDT 1WZEN ~ 1W Analysis
#ZEN Buy gradually from here if you still have a Conviction on this coin with a short -term target of at least 20%+.

ZENafter having analyzed the big W tf, i think we are at the position of making a long moove.
we do have 2 targets 1st TP and second one of the long possition.
spot trade.
nfa
dyor

ZENHorizen, i think that this is the deep bottom for ZEN.
probably something will be cooking from here..
lets see if we will get notified for any uptrend move.
spot.
nfa
dyor

ZEN Downtrend
The strong downside doesn´t seem to be over, and the wrapping up of the green abc correction should lead us to fresh new los under 9.88.
Red support could give us a correction to the upside on smaller timeframes, but I am considering this an opportunity for a short trade.

ZEN/USDTKey Level Zone: 15.230 - 15.500
HMT v6 detected. The setup looks promising, supported by a previous upward/downward trend with increasing volume and momentum, presenting an excellent reward-to-risk opportunity.
HMT (High Momentum Trending):
HMT is based on trend, momentum, volume, and market structure across multiple timeframes. It highlights setups with strong potential for upward movement and higher rewards.
Whenever I spot a signal for my own trading, I’ll share it. Please note that conducting a comprehensive analysis on a single timeframe chart can be quite challenging and sometimes confusing. I appreciate your understanding of the effort involved.
Important Note :
Role of Key Levels:
- These zones are critical for analyzing price trends. If the key level zone holds, the price may continue trending in the expected direction. However, momentum may increase or decrease based on subsequent patterns.
- Breakouts: If the key level zone breaks, it signals a stop-out. For reversal traders, this presents an opportunity to consider switching direction, as the price often retests these zones, which may act as strong support-turned-resistance (or vice versa).
My Trading Rules
Risk Management
- Maximum risk per trade: 2.5%.
- Leverage: 5x.
Exit Strategy
Profit-Taking:
- Sell at least 70% on the 3rd wave up (LTF Wave 5).
- Typically, sell 50% during a high-volume spike.
- Adjust stop-loss to breakeven once the trade achieves a 1.5:1 reward-to-risk ratio.
- If the market shows signs of losing momentum or divergence, ill will exit at breakeven.
The market is highly dynamic and constantly changing. HMT signals and target profit (TP) levels are based on the current price and movement, but market conditions can shift instantly, so it is crucial to remain adaptable and follow the market's movement.
If you find this signal/analysis meaningful, kindly like and share it.
Thank you for your support~
Sharing this with love!
HMT v2.0:
- Major update to the Momentum indicator
- Reduced false signals from inaccurate momentum detection
- New screener with improved accuracy and fewer signals
HMT v3.0:
- Added liquidity factor to enhance trend continuation
- Improved potential for momentum-based plays
- Increased winning probability by reducing entries during peaks
HMT v3.1:
- Enhanced entry confirmation for improved reward-to-risk ratios
HMT v4.0:
- Incorporated buying and selling pressure in lower timeframes to enhance the probability of trending moves while optimizing entry timing and scaling
HMT v4.1:
- Enhanced take-profit (TP) target by incorporating market structure analysis
HMT v5 :
Date: 23/01/2025
- Refined wave analysis for trending conditions
- Incorporated lower timeframe (LTF) momentum to strengthen trend reliability
- Re-aligned and re-balanced entry conditions for improved accuracy
HMT v6 :
Date : 15/02/2025
- Integrated strong accumulation activity into in-depth wave analysis

BUY SPOT RENUSDT (Short-Term Strategy with Rainbow MG3 H1 - D1)🚀 BUY SPOT RENUSDT (Short-Term Strategy with Rainbow MG3 H1 - D1)
📢 RENUSDT is in a weekly downtrend, presenting a strategic spot buy opportunity for short-term gains.
📌 Trade Setup & Market Outlook
✔ While REN is in a weekly downtrend, it offers a tactical buy opportunity for a 30% strategy over the next few days.
✔ Can be combined with Rainbow MG3 indicator on H1 - D1 for signal confirmation.
📌 Trade Plan:
Trend: Buy spot.
Entry Point: $12 or around that level.
Target: $15 - $16.5.
Hold Time: This week (Short-term trade).
💡 Key Considerations:
✔ Use Rainbow MG3 indicator on H1 - D1 to refine entry signals.
✔ Monitor breakout confirmations for stronger momentum.
✔ Manage risk and take profits gradually near targets.
🔥 RENUSDT is setting up for a solid short-term trade – Stay alert for the right entry! 🚀

ZEN’s Reversal Zone – Perfect Time to Go Long?ZEN has seen a sharp 78.65% decline from its $46.28 high, dropping over the past 40 days. With six consecutive red daily candles, we’re at a critical point to determine whether a bullish reversal is near or if further downside is ahead. Let's analyse the key support and resistance zones and establish high-probability trade setups.
Support Levels & Confluences
1️⃣ Psychological Support – $10: Price bounced off $10, aligning with the 0.886 Fib retracement.
2️⃣ Trend-Based Fib Extension 0.786 – $11.33: Indicates potential correction completion
3️⃣ Yearly Open from 2021 – $11.61: Acts as a historical support level
4️⃣ Weekly Support at $11.48 (0.618 Fib Retracement): Aligns with the weekly order block ($12.13 - $11.45)
5️⃣ Monthly 21 SMA – $10.86: Aligns with the 0.786 Fib
Long Trade Setups – Laddering Strategy
Long positions can be laddered from $11.48 (0.618 Fib) down to $10.82 (0.786 Fib) for a better cost basis.
Long Entry #1: $11.48 (0.618 Fib Retracement)
Long Entry #2: $11.00 (Mid-range level between fibs)
Long Entry #3: $10.82 (0.786 Fib Retracement)
Stop Loss: Below $10.60
Take Profit: $14 - $15
R:R: 13:1 (for 0.786 Fib entry)
This laddering approach allows for better risk management and capital allocation.
Alternative Long Entry – Confirmation-Based Trade
Entry: If price reclaims $12.11 (Daily Open & Weekly Level) and retests it as support
Stop Loss: Below $11.48
Target: $14 - $15
R:R: 3:1
Resistance Levels & Short Setup
1️⃣ Weekly Open - $14.20
2️⃣ Monthly Level - $14.85
3️⃣ Weekly Level - $15.12
4️⃣ Key Resistance - $15
5️⃣ 0.5 Fib Retracement from Downward Wave - $15.25
6️⃣ Weekly 21 SMA - $14.92
Short Setup (If Price Reaches Resistance & Shows Weakness)
Entry: Between $14.85 - $15.25
Stop Loss: Above $15.50
Take Profit: $14.2 - wOpen
Key Takeaways:
Ladder long entries from $11.48 - $10.82 to maximise R:R
Alternative long trade if price confirms $12.11 as support
Strong resistance at $14.85 - $15.25, ideal for profit-taking or a short trade setup
Multiple confluences (Fib levels, moving averages, order blocks) confirm these setups
New Free Indicator Release 🚀
I've just launched a FREE TradingView indicator – Multi Timeframe 8x MA Support & Resistance Zones. It helps visualise key support and resistance levels across different timeframes. Check it out and let me know your thoughts!

ZEN Trend Successfully ChangedZEN Detailed Analysis on 4h tf.
ZEN has successfully changed it's trend from down to the upside and re testing it as well. Also it is holding well 200EMA daily + 50EMA 3D.
I am aiming the next leg up soon towards 26$ - 29$ (Fair Value Gap Area)
Hope for the best.
#nfa #dyor #aqeelonline
