ZEN: PATTERNS FAIL TOO!Dear Traders,
Today I would like to share my personal thoughts with you in hopes to contribute to the trading community. When I was a novice trader, I used to trust patterns blindly, like they're sent by God! But I learned that the market SOMETIMES works according to patterns. Patterns are merely guides that help us explore possibilities. To make decisions, we need to take into account a variety of factors including the context, the CRYPTO TOTAL MARKET CAP, and BTC.D/ALTS.D. The context always matters. Whether the market as a whole is struggling, improving, or stagnating can tell us a great deal about what we should do. Sometimes you notice a bullish pattern, but you feel a certain degree of unease to have an active trade in the market. That's when you should slam on the brakes and keep a cool head. The CRYPTO TOTAL MARKET CAP can tell us what the atmosphere is like in the market. Even if you spot a bullish pattern, if the TOTAL Criterion spells bleeding, you should think twice before entering a trade. BTC.D in relation to ALTS.D and ETH.D could help us make decisions if we know how they correlate. Funding rates could as well help your decision-making. When they skyrocket, greed abounds in the market, and the market will have to cool its jets to sustain its health. All in all, what I have learned is that a pattern is not a forceful indicator of what's to come. Patterns work fine when you consider the above-mentioned factors and wait for confirmations to execute your trades. ZEN might have tricked some with its wicks below the floor of the rising wedge, which is a bearish sign. Add to the mix a MACD that was going to showcase a bearish cross. If you have jumped the gun, you must be in a difficult situation now. However, you can look back on this as a learning curve passed.
I wish you the best and all the luck in the world. Take care!
P.S: I'm no expert and this is my bit I thought I could put out to help. Certainly, there are genuine experts out there you could truly learn from. Thank you for your support and attention.
ZENUSDT trade ideas

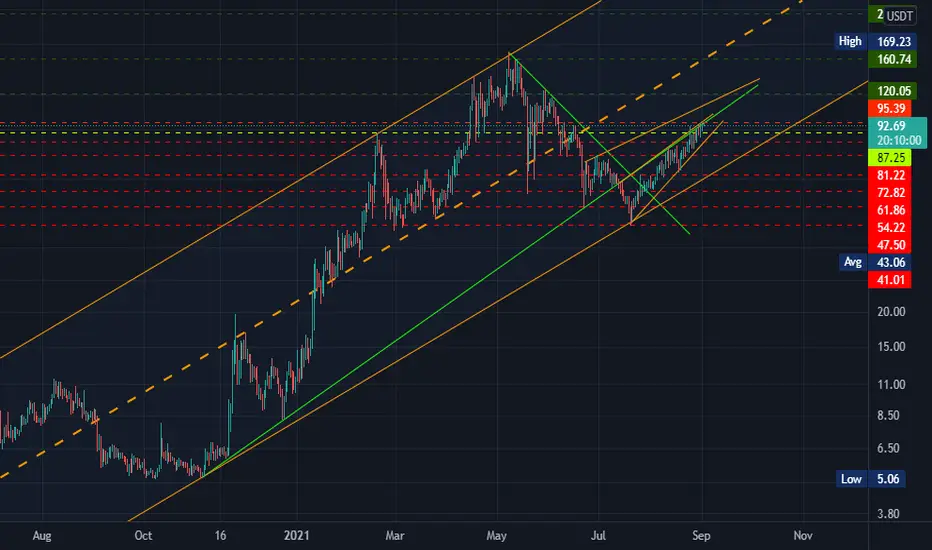
ZENUsdt Slowly But StableHorizon is slowly and stable coin
this going up slow and for fast and more profit little bad but can going up
I AM TOMBRIDER :)
FIND CLASSICAL FOR YOU :)
THIS MARKETCAP AND VALUE LOW NOW
but whale join when fast going up
this coin move slowly but have chanse for big move
Horizon can back top channle again.This channel is a valid channel due to the many collisions in the middle and above it
GL
Supports
87.25 >>> Entry Point
81.22
72.82
61.86
Resistance:
95.39
Targets:
120.05
160.74
233.28
283.10
GOAL for hold
374.24
GL guys
Horizen(Zen) update for future with 4H timeframeHorizen(Zen) appears to be forming a symmetrical triangle pattern, if it is valid, it will certainly break up towards the price of $104.

ZENUSDTPurchase order for ZENUSDT currency in time frame daily and it is better to use step purchase.

ZENUSDT Long IdeaThe price has broken a downtrend creating HH and HL on LTF. We are slowly climbing inside an ascendinh channel. On HTF the trend is bullish. This is confirmed by the RSI, MACD and Ichimoku cloud. I am expecting correction so the price action can create a HL and a breakout and retest of the Supply zone afterwards. The traget is the next supply zone.
NFA

ZEN CHART BULLISHif $ZEN break risistance 75$
we will see it the moon
now just buy and HOLD it to target in mid-term 120$
NFA


ZENUSDT is testing the upper trendline 🦐ZENUSDT is testing the upper trendline. If the price is going to satisfy all our rules, According to Plancton's strategy (check our Academy ), we can set a nice order
–––––
Follow the Shrimp 🦐
Keep in mind.
🟣 Purple structure -> Monthly structure.
🔴 Red structure -> Weekly structure.
🔵 Blue structure -> Daily structure.
🟡 Yellow structure -> 4h structure.
⚫️ Black structure -> <4h structure.

ZENUSDTPERP Trade 1Hi!
This is my first time trading ZEN/USDT.
coinmarketcap.com
Entry: 62.242
Exit: Sign of Rejection at 77.318 or candle close
EMA50 is holding and in daily time frame it is a support area and confluence with 0.618 reverse fib. Also it created a higher lower which gave us a better risk reward ratio.


ZENUSDT up to 82$i see in zen both a triangle pattern and a head and shoulder pattern ; the downtrend line is also broken

ZENUSDT Good BUY!ZENUSDT Technical analysis Update
ZEN/USDT currently trading at $62.00
Resistance Zone Breakout
Buy level: Above $61.50 - $62.20
Stop loss: $59.00
TP1: $65.00
TP2: $68.50
TP3: $71.50
TP4: $75.00
Max Leverage 3x
Always keep Stop loss
Note: please do your own research before investing. Never invest money that you can't afford to lose.

zenusdt zen usdt has formed a symetrical tringle. below is support of 200MA and 13 and 21 ema .looks good
NF .DYOR

Horizen (ZEN) formed bullish BAT for a good long opportunityHi dear friends, hope you are well and welcome to the new update on Horizen ( ZEN ) coin.
Previously we had a nice trade of ZEN coin.
On a 4-hourly chart, the price line of ZEN has formed bullish BAT.

ZEN USDTZen is a short to me honestly
I think it'll go down to MA200
Close 30% of position at 54.24$, 40$ at 53.55$ and move stop loss to entry for the other 30% with the take profit 52.87

ZENUSDT Wedge Pattern Formation!ZENUSDT Technical analaysis Update
ZENUSDT currently trading at 53.75
Wedge Pattern Formation.
You can see in the chart four times it reversed from the resistance line and three times bounce back from the support downtrend line. After 60 days of continuous 75% correction finally, it breaks the wedge pattern (resistance line), we can confirm this breakout because the daily candle closed above the resistance line and volume also increased compared to the last 30 days. I'm expecting a small retracement in few days after that we can expect an up move.
Buy level : $50.00- $55.00
Stop loss: 39.00
TP1: $72.00
TP2: $85.00
TP3: $115.00
TP4: $160.00
TP5: $200.00
Note: please do your own research before investing. Never invest money that you can't afford to lose. Every investment involves the risk of losing the entire invested money.


ZEN/USDTLooks good on daily time frame , would like to see a clear breakout before aping in .
Target on Chart.


🆓Horizen (ZEN) June-28 #ZEN $ZENZEN is accumulating at the $60 zone and will head towards the $80 and $100 zone in July. However, if in the next few days, ZEN loses the $60 zone, it will have a sharp decline towards the 40$ zone and this is a very good area to buy in
📈BUY
🔴Buy : 58.5-61.5$. SL if B
📉SELL
🔴Sell : 78-82$. SL if A
🔴Sell : 97.5-102.5$. SL if A
♻️BACK-UP
🔵Sell : 58.5-61.5$ if B. SL if A
🔵Buy : 39-41$. SL if B
❓Details
🕯Timeframe : 1 Day
📈Red Arrow : Main Direction as BUY and SELL section
📉Blue Arrow : Back-Up Direction as BACK-UP section
🟩Green zone : Support zone as BUY section
🟥Red zone : Resistance zone as SELL section
🅰️A : The Close price of candlestick is Above the zone
🅱️B : The Close price of candlestick is Below the zone


