Look for retrace back to 60 before continued uptrend 120 incominNot financial advice.
"Definition of success is measured not by $ but by improving on the faults and failures of the generations before you"
Legalizedhustler
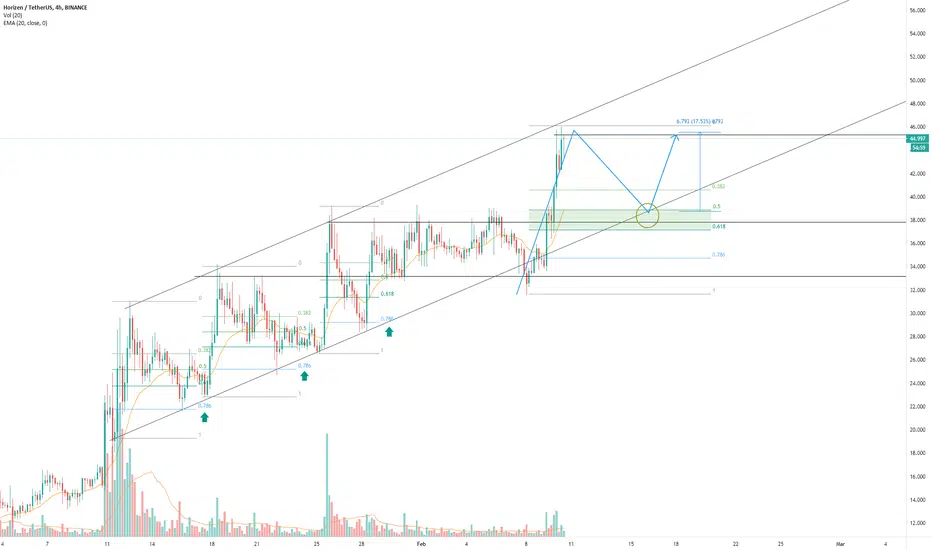
Rem has been on a slow and steady increase for awhile now.
Wonderful project can hit 120 in current cycle.
Thats not law.
Look at circled area as a repeat of that seems likely.
So 60-70 range trading.
Buy @60 stop loss 41.00
In a beautiful steady uptrend.
Support the legalizedhustler
#hustlabynature
ZENUSDT trade ideas

Horizen (ZEN) • Final major resistance before next 10xWe are just meeting final structural target based on past PA.
I still see this a hold because chances this will do another 10x from where we are.
In terms of fundamentals is still strong. Backed by Grayscale, continuous development and growing community.
In terms of technicals is still strong. Volumes show steady growing interest but nothing really usual or fomo like volume signatures, major trendlines has not been broken, trading above clouds, consistently trading above weekly averages. I see no reason to sell this coin.

HORIZEN (ZEN) GREAT POTENTIALHello Traders
As you can see in the chart above, ZEN is Extremely bullish on technicals
if we see the ZEN/BTC chart, it obviously has a great potential on both USDT and BTC pairs.
On the other hand
Recently I'm more focused on fundamentals, to
this project has robust technology. It's a privacy token, too, with a cross-chain.
Recently ETH has a high gas, so all of the scalability tokens started to pump.
------------------------------------------------------------------------
What is your opinion? Comment below.
If you like the idea, please hit the like button and follow me so that you won't miss the updates. The information given is never financial advice. Always do your research too.
Goodluck.

Horizen Long limit entryEntry long limit 39,300
SL 35,850
PT1 45,600
PT2 52,500
BE 44,400
mid term
RRR 1,8:1
BINANCE:ZENUSDT

ZENUSDTPrice broke out of the Weekly Control Candle. Came back to test the breakout. Adding to my longterm position.

ZENUSDT - BUYPrice trading nicely within a bullish channel and historically retraces deep to the to the 78.6 fibb level.
I have marked the confluence zone of the 32.8% of the last impulse move, previous support and the January 11th trend line as a potential buy zone.

#HORIZEN #ZENUSDT #4HHi guys..its the latest analyze chart of ZENUSDT in 4H timeframe .if you are interested any crypto that you want analyze with me and any questions please do not hesitate and comment below the chart!
if u like it press like-comment and folow me.thx

50% retracement and then follow again the uptrendI see in short term a retracement to 50% fibo level, to 27 usd, and them follow again the uptrend to ATH at 60$.

ZENUSDT ANALYSESas u see trend line is already broken to down andd i expect a correction to fibo levels T1 AND T2 $$$


#ZEN/BTC - Potential 99.15% #NEWS
#LONG
#ZEN/BTC - Potential 99.15%
Optional Leverage: N/A
Entry - 35.77
TP1 (50%) - 39.105
TP2 (25%) - 42.114
TP3 (25%) - 45.986
SL - 31.038
- BTC - BTC PRICE Stable, BTC DOM Decrease = ALTS Increase
- Trigger: LISTING ANNOUNCEMENT
- RR - 2.16
- Trailing Buy - 3%
- Trailing Profit - 5%
- Trailing Stop-Loss - no

ZEN/USD - Watch this bearish divergence!ZEN has done very well these past few weeks. However, if you are looking to buy longer term, you need to watch out for this massive bearish divergence we have here.
RSI + MACD + Volume are all painting a very clear bearish divergence on the daily timeframe with lower highs every time we went higher in price. This shows buying interest is fading and once the momentum flips, price can quick fall down to support.
Nevertheless, ZEN can still push higher, but not by much in my opinion before sell pressure will take over and bears will have a party.
Levels on the chart. Don't FOMO. :)
Like and follow if you liked this idea!


#ZEN/USDTPERP - Potential 15.11% #SWING
#LONG
#ZEN/USDTPERP - Potential 15.11%
Optional Leverage: 3x
Entry- 33.325
TP1- 35.873 (75%)
TP2- 38.257 (25%)
SL- 30.624
- Key Notes - BTC consolidating - ALT's showing strength
- RR - 1.92
- Trailing Buy - 0.5%
- Trailing Profit - 1%
- Trailing Stop-Loss - No


ZENUSDT ShortNew tokens on Binance pump and dump during the first few weeks using this for the short game :)


ZENUSDT - POTENTIAL RETRACEMENT ANALYSIS
- ZENUSDT brokeout above the previous ATH resistance.
- Price action is to printing a rising wedge pattern.
- RSI is a printing a bearish divergence signal.
SELL ENTRY ⬇️
- Breakdown below the rising wedge support.
TARGETS 🎯
- Fibonacci retracement levels
- Flip horizontal support (previous ATH).
SETUP INVALIDATION ❌
- Breakout above the rising wedge resistance.

ZENUSDT - Descending channel ANALYSIS 🔎
- ZENUSDT is printing a descending channel.
- Price is testing the descending channel resistance.
- The minor uptrend is supported by an ascending trendline support.
POSSIBLE PRICE ACTIONS
- Bullish ⬆️: breakout above the descending channel's resistance.
- Bearish ⬇️: breakdown below the ascending trendline support.
TARGETS 🎯
- Bullish ⬆️: horizontal resistance levels (R1, R2).
- Bearish ⬇️: horizontal support level (S1), descending channel support.


the bullflag they don't want you to see!After profitting from this majestic inverse head and shoulders, this potential bullflag might become the truth! since grayscale is disbanding their XRP fund, their ripple refugee's need somewhere to go. The investors with a certain risk appetite are flowing into $zen right now.
