ZEN has strong resistance levelThis instrument is in the top growth today, during the current correction, half of the daily imbalance was blocked from below and there were no updates to the daily lows, which is a plus in the continuation of the long, along the trend the price is pressed to the previously formed cascade of levels starting from $ 8.4, which has several smooth touches, I will wait for an increase in buyer activity in the breakdown and continuation growth according to the trend for the withdrawal of liquidity behind the cascade to the nearest area of interest of the seller
ZENUSDT trade ideas

easy short positionstrong institutional funded candle(IFC) located between 8.613 to 8.776 based on SMC

ZENUSDTZENUSDT is been on bullish path but recently it has formed a reversal pattern, HeadnShoulder. Break of neckline will indicate a reversal for the instrument.

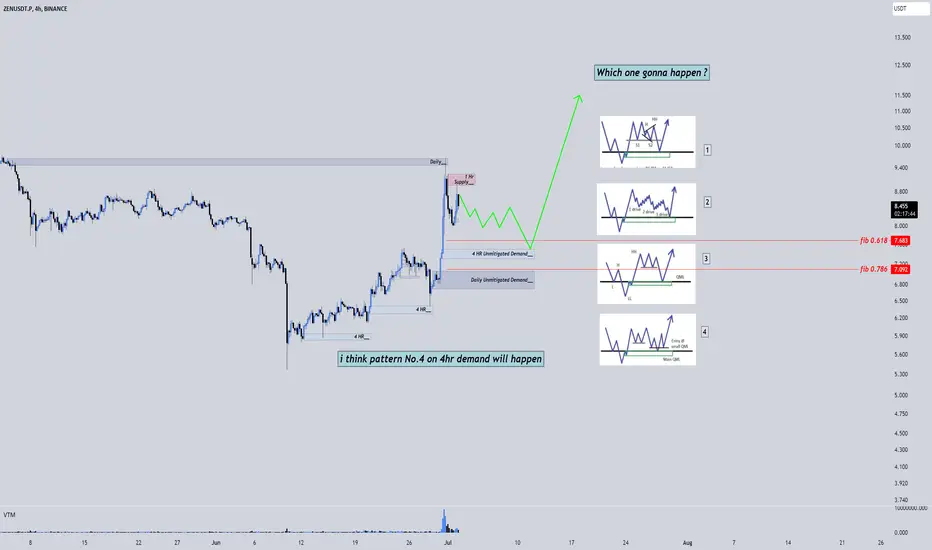
4 possible pattern for ZEN in next 2 weekbased on supply demand and QM pattern we can expect these patterns
they are so similar but i believe No.4 gonna happen because ZEN already goes up about 40% in past 2 week so have to slowly bring some orders down
also 4hr demand zone is between fib 0.618 and 0.786(another confirmation on 4hr demand zone)
Finally Zen Looks Ready For Decent Recovery Seems Like Has Already Bottomed Out & Building Up For Breakout Formed Falling Wedge In 3 days tf Incase Of Breakout Expecting 250%+ Bullish wave

✴️ Horizen Deletes Its 2021 Bull-Market, What Now?Horizen (ZENUSDT) hit an All-Time High May 2021. After a bull market comes a bear market.
The bear market that followed deletes almost all gains; ZEN has dropped by 96.84% since the ATH date, astonishing.
Prices went as low as September/October 2020, more than 2.5 years ago.
So Horizen now is entering the accumulation/buy zone.
This is the best time to buy, when prices are low, near support/red.
This is what I personally do, buy and hold long-term... Wait patiently and let the market take care of the rest... Keeping it simple, think long-term.
This is not financial advice.
Thanks a lot for your support.
Namaste.

ZEN buy signalZEN looks like an interesting position to buy. Capitulation Signal (gold stripe) signaled in line with major high time frame trends

horizen long setup Hello Traders, here is the full analysis for this pair, let me know in the comment section below if you have any questions, the entry will be taken only if all rules of the strategies will be satisfied. I suggest you keep this pair on your watchlist and see if the rules of your strategy are satisfied. Please also refer to the Important Risk Notice linked below.

ZEN failed to breakout from prev week highweak PA under prev weeks highs and now breaking down at trendline. will cut if reclaims trendline

zenit is in the imp support. if bitcoin breaks the support this coin can go down and give more profit

ZENUSDT#ZENUSDT
buy and hold it to the next targets at the chart
RSI showing bullish EMAs showing a bullish move MACD is showing bullish ZELMA is neutral Ichimoku cloud is bullish Fib retracement is showing bullishAAccumulation distribution is neutral will pump following Bitcoin ( BTCUSD )
we have powerful support zone

Getting ready for Massive recovery Seems Like has already bottomed out & formed falling wedge in 3 Days timeframe incase of Upside Breakout expecting 300%+ bullish wave In midterm


ZENUSDT LONG IDEAZENUSDT has broken its ascending triangle and can move upwards.
tp1:12.37
tp2:12.83
tp3:14.05
tp4:14.86
sl:10.24

$zen ranging on the H1 in the 2 white lines
try getting your entry as close to lower white line do you can define your risk.
break up is a buy to possibly upper yellow line but for now first line will do ...


ZEN LOOKS BULLISHHi, dear traders. how are you ? Today we have a viewpoint to BUY/LONG the ZEN symbol.
For risk management, please don't forget stop loss and capital management
When we reach the first target, save some profit and then change the stop to entry
Comment if you have any questions
Thank You

ZENUSDT Short Trade!ZENUSDT Short Setup
Short level: Above $10.37
Stop loss : $10.62
Support 1 : $10.10
Support 2 : $9.60
Support 3 : $8.87
Thanks
Hexa


ZEN ANALYSIS 1DHi, dear traders. how are you ? Today we have a viewpoint to BUY/SELL the ZEN symbol.
For risk management, please don't forget stop loss and capital management
When we reach the first target, save some profit and then change the stop to entry
Comment if you have any questions
Thank You


ZENUSDT Elliott Waves (Local Setup)Hello friends.
Please support my work by clicking the LIKE button👍(If you liked). Also i will appreciate for ur activity. Thank you!
Everything on the chart.
Entry: market and lower
Target: 15 and 17.2
after first target reached move ur stop to breakeven
Stop: ~10.7 (depending of ur risk). ALWAYS follow ur RM .
RR: 1 to 4
risk is justified
Good luck everyone!
Follow me on TRADINGView, if you don't want to miss my next analysis or signals.
It's not financial advice.
Dont Forget, always make your own research before to trade my ideas!
Open to any questions and suggestions.
