#ZETA Looks prime for a 300% Rally but can you Hold?NYSE:ZETA looks promising, breaking out as we speak.
I've opened a small position and plan to increase it too if it dips into my buy zones.
My manual buy levels are:
- $0.7889
- $0.7557
- $0.7122
- $0.6867
SL: $0.5901
Targets: .97, 1.26, 1.55, 1.87, 2.17, 2.55, 2.89, 3.01
Feel free to add and DCA (Dollar Cost Average) if you like it when it dips.
dyor, nfa
$FIDA
Do hit that like button if you like it and share your views in the comment section.
Thank you
#PEACE
ZETAUSDT trade ideas

Support range: 0.6903-0.7160
Hello, traders.
If you "Follow", you can always get new information quickly.
Please click "Boost" as well.
Have a nice day today.
-------------------------------------
(ZETAUSDT 1W chart)
The point to watch is whether the MS-Signal (M-Signal on the 1W chart) indicator can rise above and maintain the price.
In other words, the key is whether it can receive support near 0.7160 and rise above 0.618 (0.8178).
-
(1D chart)
The current volume profile range is formed at 2.0699.
Therefore, from the current price position, it is expected that a full-fledged uptrend will begin only when it rises above 2.0699.
In order to show such an uptrend, it is important to first find support near 0.7160 and then rise above 0.8390.
If it fails to rise and falls below 0.6903, it is necessary to check whether it can find support near 0.5408.
-
Have a good time.
Thank you.
--------------------------------------------------
- Big picture
I used TradingView's INDEX chart to check the entire range of BTC.
(BTCUSD 12M chart)
Looking at the big picture, it seems that it has been maintaining an uptrend following a pattern since 2015.
In other words, it is a pattern that maintains a 3-year uptrend and faces a 1-year downtrend.
Accordingly, the upward trend is expected to continue until 2025.
-
(LOG chart)
As you can see from the LOG chart, the upward trend is decreasing.
Accordingly, the 46K-48K range is expected to be a very important support and resistance range from a long-term perspective.
Therefore, we do not expect to see prices below 44K-48K in the future.
-
The Fibonacci ratio on the left is the Fibonacci ratio of the upward trend that started in 2015.
In other words, it is the Fibonacci ratio of the first wave of the upward wave.
The Fibonacci ratio on the right is the Fibonacci ratio of the upward trend that started in 2019.
Therefore, it is expected that this Fibonacci ratio will be used until 2026.
-
No matter what anyone says, the chart has already been created and is already moving.
It is up to you to decide how to view and respond to this.
When the ATH is updated, there are no support and resistance points, so the Fibonacci ratio can be used appropriately.
However, although the Fibonacci ratio is useful for chart analysis, it is ambiguous when used as support and resistance.
This is because the user must directly select the important selection points required to create Fibonacci.
Therefore, since it is expressed differently depending on how the user specifies the selection points, it can be useful for chart analysis, but it can be seen as ambiguous when used for trading strategies.
1st : 44234.54
2nd : 61383.23
3rd : 89126.41
101875.70-106275.10 (Overshooting)
4th : 134018.28
151166.97-157451.83 (Overshooting)
5th : 178910.15
-----------------

ZETAUSDT Ascending Triangle PatternZETAUSDT Technical analysis update
ZETA price has formed an ascending triangle pattern on the daily chart and is moving towards the triangle's resistance for a potential breakout. The price is trading above the 100 EMA, which is considered bullish. A confirmed breakout can be anticipated once the price surpasses the 0.80 level on the daily chart. If this breakout occurs, it may lead to strong upward momentum and further bullish action.

ZETAUSDTHMT v1.0 spotted. Looking good with previous wave up with increasing volume and momentum.
- BOS (Breaks of Structure) at @ 0.7425 - 0.7508 level
- Trending slow and steady if able to hold above the BOS level
It is at extremely good reward to risk level.

ZetaChain could face major market sentiments.Hello, fellow traders!
This is my analysis on ZetaChain (ZETAUSDT).
1️⃣ Analysis
Price has been in a downtrend since February to August. In August, we see an attempt of a breakout with significant volume spike. The breakout seemed like a failure until the second breakout took place at the end of the month which then converted the resistance line (red trendline) into a support line of a new trend. We now see an ascending triangle pattern which the price is reacting to in high accuracy.
2️⃣ Expectations
The price might move sideways longer but breakout is expected in near future for either direction. Upper breakout could indicate start of a strong uptrend. However, major resistance at 1.1406 (red dotted line) is expected. Lower breakout could indicate a stronger downtrend. Although major support at 0.3348 (green line) is expected, failure of an attempted reversal might trigger more aggressive downtrend resulting in a new ATL below the green line.
3️⃣ Key approach
Our first strategy is to enter short in lower breakout. Our target would be 0.3348, major support level. Price may rebound upon touching the level. This could open up new long opportunities, however keep in mind that downtrend might continue below the level. Failed reversal might enhance the aggressiveness of the original trend.
4️⃣ Other approach
Our second strategy is to enter long in upper breakout. Our initial target would be 1.1406, major resistance level. Our next and final target would be 1.7, right below the demand zone. However, I find this approach risky and would prefer the first one.
5️⃣ Considerations
There is an announcement that ZetaChain is unlocking 54 million tokens on December 1st. This could possibly trigger the breakout.
💡 ZetaChain is a good example that volume spike doesn't always guarantee a reversal of trend. This is a valuable lesson to learn: I hate to mention BINANCE:BICOUSDT.P so many times, but we see a similar pattern in Biconomy - breakout with volume spike after months of downtrend and resistance line being respected. Of course, we cannot say ZetaChain is foreshadowing Biconomy because they are totally different cryptos. But at least it gives us a glimpse of what to expect.
React, don't predict! Stay disciplined and patient. Don't get greedy and be thankful.
Colossians 3:12

ZETAUSDT Bearish Continuation.ZETAUSDT TEchnical analysis update
ZETA has formed a bearish triangle pattern on the 4-hour chart. A breakdown below the triangle's support level has been confirmed, suggesting increased bearish momentum. With this breakdown, the price may potentially drop to the $0.34 level as the next support target. If selling pressure continues, further declines could occur before any signs of a reversal emerge.

ZETAUSDTZETA ~ 2D
#ZETA If you have Conviction on this coin. Maybe you can make purchases in stages starting from here. with a short term target of at least 15%++, This resistance line is starting to weaken at this time.

Unlocking the Comedy: When Token Vesting Turns into a Token DumpThis particular COINBASE:ZETAUSD COINBASE:ZETAUSD project has a 13% unlock of the circulating supply , which, while not as extreme as BINANCE:TIAUSDT 's 80% set to release in under 48 hours, still presents a solid opportunity for profit. I speculate and anticipate a 15% price drop within four days following the unlock , as those receiving the tokens are likely to sell off a great portion to unsuspecting investors.
When researching the founders, it’s evident they are trying to maintain a low profile , which is often a red flag for projects lacking substance. The founders, Charlie Pyle and Ankur Nandwani, have not made significant contributions relative to the enormous funds they are collecting through this questionable venture. Notably, they recently left or were fired from prominent projects, likely seeing an opportunity to cash in by launching yet another crypto project amidst the sea of existing ones . They seem to be targeting decentralization believers and hopefuls who dream of striking it rich early on, only to find themselves investing in yet another lackluster scheme. Many of these investors are eager to believe in the potential of new projects, but when you look behind the scenes, it’s often just another facade run by self-proclaimed academic philosophers with little to offer .
The upcoming cliff unlock primarily benefits core contributors and advisors, who will receive 11% of the circulating supply monthly from August 1, 2024, to February 1, 2025.
In the chart, you’ll notice some fake pumps highlighted in the green circle I drew. However, the overall trend for this project is clearly downward . The three yellow circles with purple centers indicate the days of each cliff unlock, and it’s evident that selling pressure increases in the days that follow. Keep an eye on these patterns as they reveal the true nature of the market!

#ZETA Zeta is currently at interesting cross roads on HTF, watching price here for a breakout or once again rejection
leaning towards breakout more

ZETAUSDT Is a Major Move Coming? Here’s What You Need to Know!Yello, Paradisers! Do you think #ZETAUSDT is ready for a big breakout, or could it drop even further? Here's why it's a crucial moment for this coin!
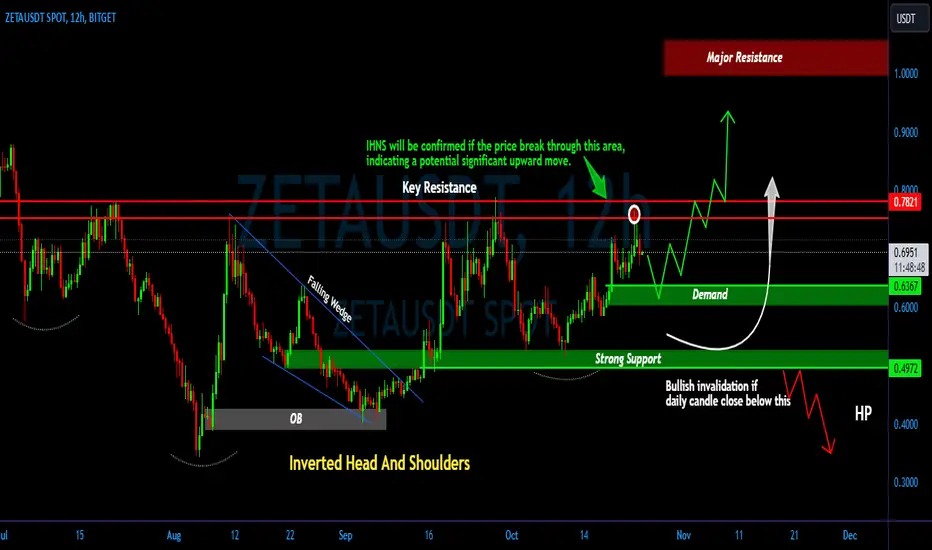
💎#ZETA is currently forming an Inverse Head and Shoulders (IHNS) pattern but has lost momentum after a strong rejection at key resistance. The price could retest the demand zone around 0.637 to regain momentum for another attempt to break through the key resistance level at 0.782. If ZETA successfully rebounds from this demand zone and breaks through the resistance, the IHNS pattern will be confirmed. In this scenario, we could see a significant upward move, as the price would have returned to a bullish structure. The highest probability target would be within our projected zone.
💎If the price fails to rebound from the demand zone and breaks below it, ZETA could continue its downward trend, potentially revisiting the strong support zone between 0.526 - 0.497. This area has held up in the past, and we expect it to act as a critical level once again. A strong rebound here would be essential for ZETA to maintain any upward momentum.
💎However, if ZETA fails to show positive signs and breaks below this strong support zone, it would be a bearish signal, likely leading to further downward movement.
If you want to be consistently profitable, you need to be extremely patient and always wait only for the best, highest probability trading opportunities! Stay disciplined and trade smart, Paradisers.
MyCryptoParadise
iFeel the success🌴

ZETAUSDTI expected price to move up and take the IDM
Tp and Sl are mentions
follow the Risk Management


Zeta for today !Zeta had a good run and stayed above 0.65 in BTC despite a small crash today.
Entry:
~0.6550
~0.6463
~0.6373
Take Profit:
TP1: 0.6919
TP2: 0.7584
TP3: 0.7932
Stop Loss:
if 4-hour candle closes below 0.63
0.6249
otherwise
0.6190

CRYPTO COIN - ZETA LONG The chart shows a strong increase in volume (indicated by arrows), which suggests growing interest in the ZETA coin. After breaking through the descending trendline, the price formed several local highs, indicating the potential for further growth.
The price has already surpassed the $0.6747 level and is approaching the first target at $0.7888, which could yield approximately 6.91% growth. Further resistance levels are expected at $0.8705 (+18.28%) and $0.9301 (+26.61%).

ZETA Buy/Trade Opportunity - Fundamentals FocusDescrizione:
This trading idea focuses on the potential of ZETA cryptocurrency, highlighting its unique fundamentals and market dynamics. ZETA stands out with its innovative blockchain solutions, offering faster transaction speeds, enhanced security features, and a robust decentralized ecosystem. Backed by strong partnerships and growing adoption, ZETA has positioned itself as a key player in the DeFi and NFT sectors.
The analysis incorporates fundamental data such as market capitalization, circulating supply, and recent developments within the ZETA ecosystem. With increasing utility and investor interest, ZETA shows promise for future growth in the blockchain space.
Disclaimer:
Trading cryptocurrencies involves a high degree of risk and may not be suitable for all investors. Prices are highly volatile, and it is essential to conduct thorough research and consult with a financial advisor before engaging in any trading activity. This analysis does not constitute financial advice, and past performance is not indicative of future results. Always ensure that any investment decisions are made based on a clear understanding of the risks involved.


ZETA/USDT posible huge gains comingRight now ZETA/USDT is almost complete forming a big cup and handle on both 1 and 2 hour charts. Technicals are all showing strong buy. Could make huge gains if it works out. Let me know what you guys think since I'm just started trading a few months ago.
We The People

ZETA Squeeze MomentumTA: The chart is showing us the end of a bearish trend. However - this can be a bull trap !
🚀😂🍀💲
What Is ZetaChain (ZETA)?
ZetaChain is a novel L1 that has chain-agnostic interoperability built-in (EVM-compatible, Cosmos/IBC, Bitcoin, Dogecoin, Tron, etc.). Developers currently use ZetaChain’s messaging capabilities to send data and native value (without wrapping assets) between any chains. ZetaChain will also support native smart contracts, which let developers build omnichain dApps that orchestrate funds across chains from a single contract.
Who Are the Founders of ZetaChain?
ZetaChain’s founder was an early Coinbase employee and one of the creators of Basic Attention Token (BAT). Investors include all major market makers, top exchanges, early Coinbase and Binance employees including Dan Romero, Sam Rosenblum, and John Yi, as well as major contributors to some of the industry’s most widely adopted protocols and well known funds, including Polygon’s JD Kanani. Advisors to the project include Coinbase’s first Head of People Nathalie McGrath who scaled the industry leading exchange from 10 employees to over 800, and Juan Suarez, who served as in-house counsel at Coinbase from 2013 to 2022.
What Makes ZetaChain Unique?
ZetaChain is a blockchain that connects everything. It enables interoperability between any blockchains or layers by providing cross-chain value transfer and message delivery, as well as native omnichain smart contract support. Applications built on ZetaChain — omnichain dApps (odApps) — can leverage liquidity and data on multiple networks and read and update state on all connected networks. ZetaChain’s native omnichain smart contract platform lets developers deploy contracts with the same ease as developing dApps for a single network like Ethereum, that orchestrate data and value across many or all chains. ZetaChain’s connectivity is chain-agnostic and can connect to and bring smart contract capabilities to even non-smart-contract chains like Bitcoin and Dogecoin.

ZetaChain ZETA price is trading on good volumes. Attention!OKX:ZETAUSDT price has hit the critical liquidity zone of $0.70-0.80 on high volumes
Those who are interested in such an asset as #ZETA should now closely monitor the price's behavior.
A fix above $0.80 is a direct and fairly quick way to $1.25
Active sales in the $0.70-0.80 zone can provoke a drop to $0.46-0.47 and just from there to $1.25

ZETA - LONGThe chart shows a strong spike in volume (indicated by the arrow), which indicates a significant interest in the coin. After this, we observe a sharp price increase with the formation of a local minimum at the support zone around $0.5174.
The re-entry zone is located around $0.5174, which could be a good buying point. Further upward movement is expected, with a potential target of $0.589, offering approximately 11.24% growth.

Zeta Chain poised for MC GainZeta chain offers a unique set of offerings in a Supra-emerging market, one plagued by fragmentation, esoteric innovation, and isolation or at least low level collaboration between participants.
Zeta offers cross chain compatibility aim par with native interoperability and seamless connectivity. Such value will find tremendous demand serving financial institutions venturing into the expansive frontier of the Ethereum ecosystem and networks considered by Trad stuffers to be more speculative like Cardano , Solana, Avax and others. The value of having the capability to operate in full connectivity with a spectrum of networks is not yet fully realized and will be seen in full glory by Zeta, Pantos, and other truly cross-chain interoperable.
Zeta has come upon its cross on the weekly RSI and stochastic is in sync with all the pent up capacity for a ripping bull run. In today’s market environment, it pays to conduct your own research, veering away from low value speculation and investing early into high potential assets ready to provide 100x returns.
