Double top//@version=5
indicator("Double Top Pattern with Sell Signal", overlay=true)
threshold = input(1.0, title="Price Difference Threshold (%)")
// Double Top Detection
pivotLeft = ta.pivothigh(3, 3)
pivotRight = na(pivotLeft ) ? na : ta.pivothigh(3, 3)
doubleTop = na(pivotLeft) ? na : (math.abs(pivotLeft - pivotRight) / pivotLeft) * 100 < threshold
// Plotting the double top and marking sell signal
plotshape(doubleTop ? pivotLeft : na, location=location.abovebar, color=color.red, size=size.small, style=shape.labeldown, text="DT", title="Double Top")
plotshape(doubleTop ? low : na, location=location.belowbar, color=color.red, style=shape.triangledown, text="Sell", title="Sell Signal")
// Adding alerts
alertcondition(doubleTop, title="Double Top Alert", message="Double Top Detected! Consider Selling")
// Setting the chart to 15 minutes
timeframe = "15"
ZETAUSDT trade ideas

Double top//@version=5
indicator("Double Top Pattern with Sell Signal", overlay=true)
threshold = input(1.0, title="Price Difference Threshold (%)")
// Double Top Detection
pivotLeft = ta.pivothigh(3, 3)
pivotRight = na(pivotLeft ) ? na : ta.pivothigh(3, 3)
doubleTop = na(pivotLeft) ? na : (math.abs(pivotLeft - pivotRight) / pivotLeft) * 100 < threshold
// Plotting the double top and marking sell signal
plotshape(doubleTop ? pivotLeft : na, location=location.abovebar, color=color.red, size=size.small, style=shape.labeldown, text="DT", title="Double Top")
plotshape(doubleTop ? low : na, location=location.belowbar, color=color.red, style=shape.triangledown, text="Sell", title="Sell Signal")
// Adding alerts
alertcondition(doubleTop, title="Double Top Alert", message="Double Top Detected! Consider Selling")
// Setting the chart to 15 minutes
timeframe = "15"

Intraday. ZETA. 0.4755. ShortThe token looks very weak and has been on sale for a long time. There was virtually no pullback. We are going to retest historical lows. The token will not hold anything at the bottom. This is an excellent short candidate.

ZETA Update (4H)From where we put the red arrow on the chart, it looks like a correction pattern has started.
It looks like this is a diametric pattern that has now run out of wave C.
It can be expected that for wave D the price will reject upwards.
The targets are clear on the chart. Closing a candle below the invalidation level will violate the analysis
For risk management, please don't forget stop loss and capital management
When we reach the first target, save some profit and then change the stop to entry
Comment if you have any questions
Thank You

ZETA ANALYSIS (4H)It looks like ZETA is having a big diametric now in wave C of this diametric.
Wave C also looks like a diamond diametric.
ZETA now looks set to complete wave d of C.
We are looking for buy/long positions on the upper green range and sell/short positions on the red range.
In any direction you entered the position, control your expectations and close the position with a reasonable profit.
For risk management, please don't forget stop loss and capital management
Comment if you have any questions
Thank You

Zeta Long IdeaHello Traders,
I've identified a compelling long opportunity on ZETA cryptocurrency. We've hit a sticky point and are currently seeing a 4-hour bullish divergence on Market Cipher B. This setup suggests that a long position could be favorable.
Key Points:
Sticky Point Hit: ZETA has reached a significant support/resistance level, indicating a potential pivot.
4H Bullish Divergence on Market Cipher B: This divergence is a strong indicator of a possible upward move, making it an ideal entry point for a long position.
Target: Golden Pocket Zone: Our target for this long trade is the golden pocket zone, a crucial Fibonacci retracement level known for its high probability of price reversal.

NOT vs ZETAhello guys...
do you see a similarity between these coins?!
so we can consider a bearish trend in not coin!
___________________________
✓✓✓ Always do your research.
❒❒❒ If you have any questions, you can write them in the comments below, and I will answer them.
❤︎ ❤︎ ❤︎And please don't forget to support this idea with your likes and comment

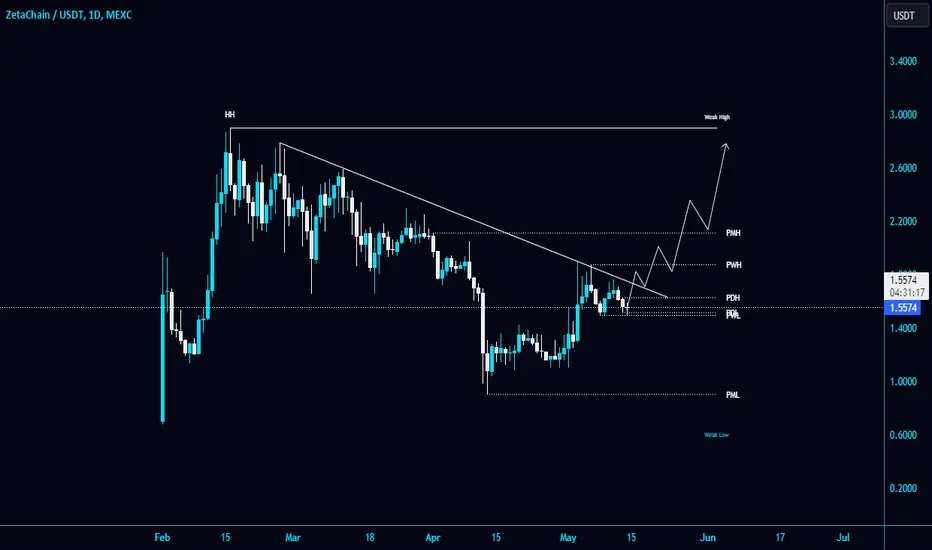
ZETA ANALYSIS (4H)It seems that a trading RANGE has been formed on the chart.
Considering the lower H's and lower L's and the formed liquidity pools, it seems that the price is going to reach the lower areas.
If you are risk averse, just wait to buy in the green range, there seems to be good buy orders in the green range.
Closing a daily candle below the invalidation level will violate the analysis
For risk management, please don't forget stop loss and capital management
When we reach the first target, save some profit and then change the stop to entry
Comment if you have any questions
Thank You

ZETA ShortHead and Shoulder pattern observed which can lead to 10-15% dump.
Ascending Channel observed.
Breakout of Resistance Line at 1.75 is SL.
Reversal confirmation at lower line of channel is 1st TP.
Resistance Line at 1.60 will act as 2nd TP if Reversal Confirmed.
If Resistance line at 1.60 breaks down then 3rd TP at 1.5.

ZETA LongAscending Channel observed.
Breakdown of channel is SL.
Reversal confirmation at upper line of channel is TP.
Strong Resistance at 1.67 can also act as TP if Reversal Confirmed.
If upper line breaks out then TP at 1.75.
Double bottom pattern observed which can lead to 10-15% pump.

ZETA Long Trade IdeaExpecting a new leg to the upside after retracing 50% from the recent price rise.
Price action is indicative of an impulsive wave to the upside.
Entry = 1.6180
SL = 1.4768
TP = 1.7596 / 1.9011 / 2.0421

SHORT #ZETASHORT #ZETAUSDT from $1.4933
30m TF. The coin is moving in a local downtrend in the form of a bearish triangle, indicating the presence of a seller moving the price to a break. A strong local support level has been formed with a lot of touches, behind which unrealized liquidity has accumulated.
I expect a smooth approach with trading, the appearance of a limit on selling in a glass and an impulse on activity.

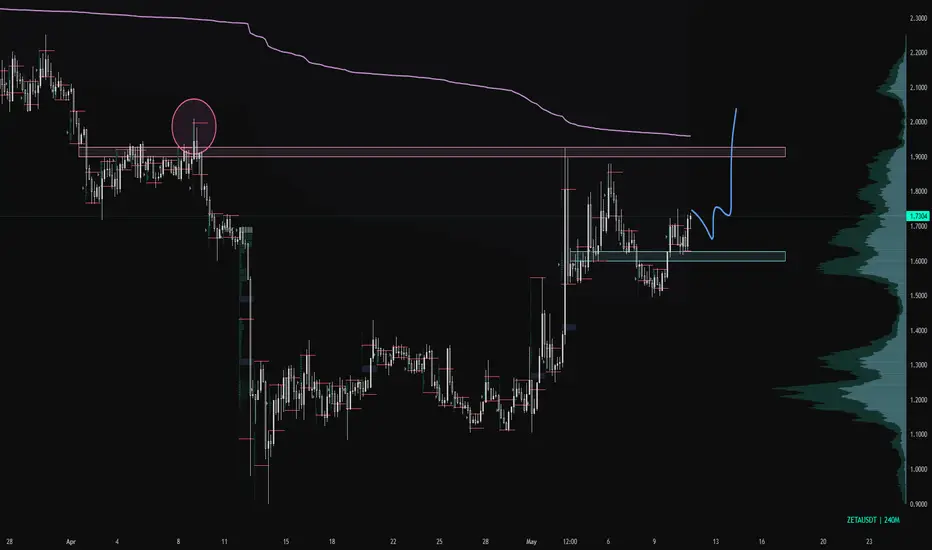
#ZETA/USDT is rejecting from the Diagonal Trendline in 4-Hour tF#ZETA/USDT is rejecting from the Diagonal Trendline in 4-Hour tF!
NYSE:ZETA is holding PWL $1.4925 as a local support level. Wait for the trendline breakout to add some in the spot. The local resistance level is PWH $1.8725.
ZETA scalp longIf we can hold 1.65 here, ZETA could spike up to the nearest inflection point which is around 1.94 to 1.98
ZETA/USDT | 1W 👀Using this asset as another tool to execute the "listing - accumulation - pump" pattern.
The coin has successfully tested the 0.618 Fibonacci level and is now showing a rebound.
- Not financial advice, trade with caution.
#Crypto #ZETA #Investment #ZetaChain
✅ Stay updated on market news and developments that may influence the price of ZetaChain. Positive or negative news can significantly impact the cryptocurrency's value.
✅ Exercise patience and discipline when executing your trading plan. Avoid making impulsive decisions driven by emotions, and adhere to your strategy even during periods of market volatility.
✅ Remember that trading always involves risk, and there are no guarantees of profit. Conduct thorough research, analyze market conditions, and be prepared for various scenarios. Trade only with funds you can afford to lose and avoid excessive risk-taking.

ZETA looks bearishContrary to the pump it has done, it seems that zeta can move towards the lower limits.
By maintaining the red range, it can drop further down. We are looking for sell/short positions in the red range.
The targets are clear on the chart.
Closing a daily candle above the invalidation level will violate the analysis.
For risk management, please don't forget stop loss and capital management
When we reach the first target, save some profit and then change the stop to entry
Comment if you have any questions
Thank You

ZetaChain (ZETA)ZetaChain (ZETA) is a cutting-edge blockchain platform designed to enable seamless interoperability across multiple blockchains. It facilitates the cross-chain transfer of assets and data, making it easier for users and developers to interact across different blockchain networks without the need for complex bridging solutions. This opens up a multitude of possibilities for integrating decentralized applications and services.
The current price of ZetaChain (ZETA) is $1.55 with a 24-hour trading volume of $1 million. ZETA has seen an increase of 13% in the last 24 hours, signaling strong market enthusiasm for its interoperability solutions.
Considering ZetaChain's role in enhancing blockchain connectivity and its recent positive market trends, the next price targets for ZETA might be set at $2.25, $2.50, and $4.00. Investors could consider entering a position now. This trading idea capitalizes on the growing trend towards blockchain interoperability, with ZetaChain positioned as a key enabler in this evolving landscape.

Zeta - New kid on the block - Broadening Wedge (Descending) Caught my attention with OKX jumpstart and the moves they have made after such as quickly listing on Coinbase (no announcement?), Binance futures (no spot?) and more others. Their listing strategy is different to other projects in the market and its refreshing to see.
Has cool tech, cross chain interoperability is the only way for the future, and these guys do it natively. Tested out the tech myself with some of their ecosystem partners (Can be found on Zeta Hub), works without a hitch so far.
On the chart, I see a descending broadening wedge with a potential double bottom. Please correct me if you think I am wrong. This is usually a bullish formation. However, of course this is a super new coin, they are generally much more unpredictable.
Currently sitting at 450-500m USD Market Cap, I believe with its cool tech, good design, good communication strategy; we should see Zeta chain in top 50 projects on CMC. That would be 5x from here.
Do your own research please, this analysis is purely for my own records, not to be taken as financial advice.

SHORT #ZETAUSDTSHORT #ZETAUSDT from $1.1385
15m TF. The instrument has formed a clear level, tested by impulsive bearish candlesticks, which may indicate active sellers in the instrument. There is also a formation of a descending triangle, pushing the price highs along the trend line to the level beyond which I expect to see an accumulation of unrealized liquidity.
I am waiting for consolidation near the level, the appearance of sales and activity in the glass before the movement.

Zeta long10.04
Concept SM We can see that price close position long trader and touch supply zone. If we want take quick trade I show ma target

LONG #ZETA availability of limit buyersLONG #ZETAUSDT from $1.9045
15m TF. The instrument has formed an ascending structure in the form of a triangle with the compression of the price lows along the trend line, which indicates the presence of limit buyers pushing the price to overshoot. There is a resistance level with a lot of touches, which confirms the presence of participants' stops behind it.
I will wait for consolidation near the level and the appearance of active purchases in the glass before the breakdown.

$ZETAUSDT 6H | LevelsOKX:ZETAUSDT 6H | Levels
Price deviates below the visible active-range. If it can reclaim the RL, upper levels can be targeted.

ZETA looks bullishZETA appears to be forming an ABC or more complex bullish pattern.
We now seem to be in wave B, which is a diametric.
The green area is a low-risk area for buy/long positions.
The targets are clear on the chart.
Closing a daily candle below the invalidation level will violate the analysis.
For risk management, please don't forget stop loss and capital management
When we reach the first target, save some profit and then change the stop to entry
Comment if you have any questions
Thank You
