ZILBTC trade ideas

zil btc about to complete shark pattern and elliotte toozil btc about to complete shark pattern
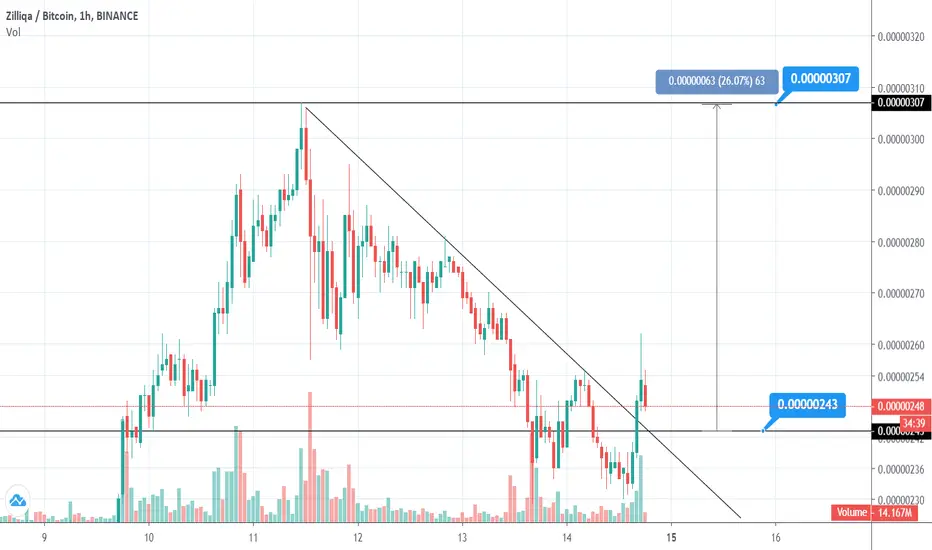
it is start from come down from 0.00000307 btc.see this chart x, a, b, c have been done we are waiting for d .
and using analysis with elliotte waves it is very soon to come back to up or make a correction. enjoy,,,,,

#Zil - Risking again reevaluated my last setup, I was trading with too tight stops & wasn't looking at the left side of charts.
Risking this falling wedge breakout setup, I see price pushing to resistance & coming down to our Fibonacci entry with printing a possible divergence, I will keep posting in the timeline as PA progress
the stop is wide for this setup as there is a potential bull flag also forming on HTF
I am not a financial advisor please MANage risk in every setup, keep your stops small & profits Big


ZIL BTC | Trend Reversal | Flow | Key Fibonacci LevelsTodays analysis – ZILBTC – trading in a possible descending channel, currently testing local support.
Points to consider:
- Flow in the market/price action
- Respecting key Fibonacci levels
- Resistance Confluence
- Trend Reversal
- Low Volume
- RSI below 50
ZILBTCs healthy counter-trend and strong continuation adds legitimacy to the money flow.
The previous swing-low respecting .618 Fibonacci retracement is indicative of a current retrace to .618 Fibonacci level.
The .618 Fibonacci level also coincides with descending channel resistance. A rejection at this level will solidify a trend reversal with a lower swing high.
An increase in volume is necessary to add legitimacy in the overall market.
RSI attempting to recover from oversold conditions. A countertrend will neutralise and prime the oscillator for a trend continuation.
Overall, in my opinion, a short trade is validated at the rejection of the resistance confluence with a technical target of local support.
Entering the trade at resistance confluence consents immediate trade invalidation (price trading beyond resistance zone), mitigating overall risk.
What are your thoughts? Let me know in the comments below!
Be sure to leave a like and follow me for daily chart updates.
As always, focus on you - and the money will too!


ZIL consolidatingZIL has come down quite a bit, hopefully it goes down below 200 sats for a healthy correction.

ZILBTC UpdateUpdate:
Choose your entry with proper stop losses based on your goals...
- Binance support for staking ZIL starts 6/19/2020
- Another Exchange started supporting staking yesterday
- ZIL can now be mined with Ethash Algorithm
- Other updates on ZIL

ZILBTC Potential IHSChoose your entry with proper stop losses based on your goals...
- Binance support for staking ZIL starts 6/19/2020
- Another Exchange started supporting staking yesterday
- ZIL can now be mined with Ethash Algorithm
- Other updates on ZIL

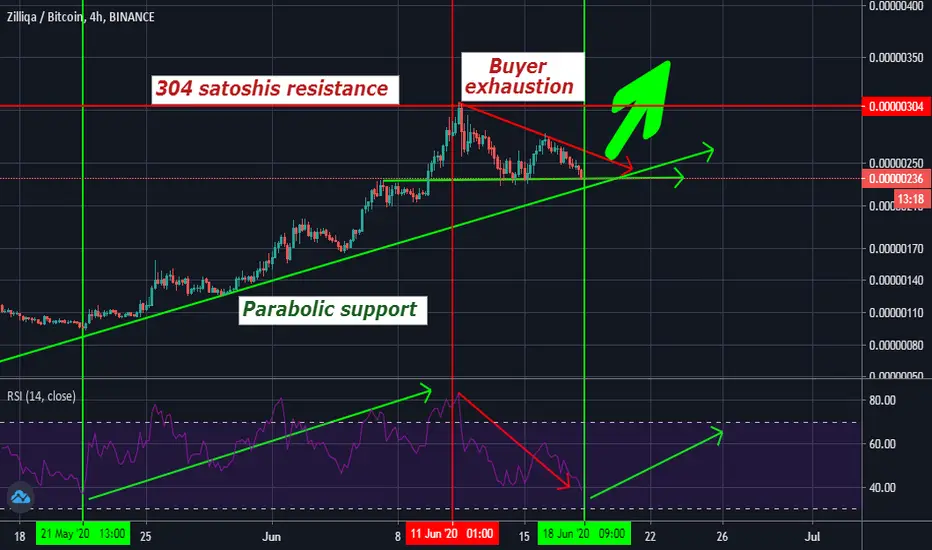
Zilliqa is showing strength Zilliqa, the asian ethereum, in the last 60 days went up a solid 208%, as you can see in the chart that resulted in a small correction on the price because it might have been over bought (shown in the declining RSI) BUT now with the RSI at a low point the asset seem to be ripe for new inventor to buy, the week hand have been shaken and the price is likely to go up.
Long on ZILAs the market starts to align for a strong push upwards we start checking on the usual coins with great buildup to recover.
The scenario as I see it is a push towards to 650 followed by a retrace in the 500 zone and blasting all the way to 1200 at least.
No trading advice.

ZIL/BTC Breakout to 180+ SatsZIL Breakout to 180+ sats after 155 is breached. Easy 30% move incoming

#Zil - Waiting forming a possible descending triangle, after the pump we had this is probably a continuation pattern, waiting to see the reaction at the support if all looks good then enter a Long/Buy with Good R:r setup.
the reason why I say WAIT is because of the heinous wicks we have. it's better to wait for a candle close above support rather than blindly entering, we might miss the entry by few sats but at least we have confirmation we need.

ZIL/BTC (Potential Lower High?)ZIL/BTC
-please examine the chart
-both trade setup is already posted
-always apply risk management
-thank you, happy trading


ZIL / BTC Bullish Trade IdeaZilliqa is trying to break above that falling wedge pattern. Set your alerts to the upper trendline of the falling wedge and if breaks out with confirmed volume you can let it ride for more room.

I started to see this coin.......I started to see this coin as a money pitfall due to my own personal loses.
One of its creators used to work for the US Air Force, a far cry from Business we could say.
Exclusively for Zilliqa, they created their own Computer language: ZILLA and with it came
their own massive challenges that no amount money can fix in a year or two.
According to a single line on this graphic we can see that it fails to reach its launching price.
Are they done already to see the kind of growth experienced only at the very start, or will it go back to the same old pattern? Only time can tell, and for everybody else as well Time is Money.