A trading opportunity to buy in ZILBTCTechnical analysis: . ZILLIQA/BITCOIN is in a range bound and the beginning of uptrend is expected. .The price is above the 21-Day WEMA which acts as a dynamic support. . The RSI is at 52. Trading suggestion: . There is a possibility of temporary retracement to suggested support zone (0.00000458 to 0.00000412). if so, traders can set orders based on Price Action and expect to reach short-term targets. Beginning of entry zone (0.00000458) Ending of entry zone (0.00000412) Entry signal: Signal to enter the market occurs when the price comes to "Buy zone" then forms one of the reversal patterns, whether "Bullish Engulfing" , "Hammer" or "Valley" in other words, NO entry signal when the price comes to the zone BUT after any of the reversal patterns is formed in the zone. To learn more about "Entry signal" and the special version of our "Price Action" strategy FOLLOW our lessons: Take Profits: TP1= @ 0.00000500 TP2= @ 0.00000576 TP3= @ 0.00000680 TP4= @ 0.00000684 TP5= @ 0.00000684 TP6= @ 0.00000832 TP7= @ 0.00000960 TP8= @ 0.00001130 TP9= @ 0.00001370 TP10= @ 0.00001610 TP11= @ 0.00001955 TP12= @ 0.00002393 TP13= FreeZLongby ForecastCity2213
ZILBTC - THE BEGINNING OF NEW WAVE UP.DIVERGENCE SPOTTED ON THE RSI GIVING US AN ACCURATE ENTY TO LONGZLongby EmperorDiamond3
Zil/Btc SOT chart off March - week 4I think Zil will continue on it's 4 hourly uptrend to attack the tested daily and weekly levels above. It is also hovering over a tested weekly level. Hopefully it breaks out of it's local hourly downtrend and takes a run up. Entry - 494 Stop Loss - 480 3% Target 1 - 509 3% Target 2 - 524 6% Target 3 - 566 14.6% *Legend* Monthly - Grey Weekly - Yellow Daily - Red 4 Hour - Green 1 Hour - Blue Zby OisnGribben2
ZIL Crossing 77 over 231 On 343min ChartZIL is looking ready for some solid gains. We have crossed 7 over 77 BO$$ Method style on a 343min, and now we see that the 77 is crossing over the 231. We broke up above the .382 horizontal fib line and are now moving up in the ascending portion of our sine waveZLongby jazzman1959113
ZILBTCZILBTC Entonnoir : W/D/H4 (swing) J'ai TP 100% de ma position en profit sur ralentissement H4. La zone de S/R des ~500 est trop dure à passer. Je reprendrai position une fois celle-ci passée de façon franche. ————— Funnel : W/D/H4 (swing) I sold 100% of my position in profit on a slowdown on H4. The zone of S/R at ~500 is way to hard to pass for now. I'll go long again once we crossed it.Zby Somstradamus0
Buy the breakoutWe're at the 50ema once again if we close above it look for the potential of an uptrend to ride gl, We must stay above it though set stop loss just below the 50ema if we break above gl.ZLongby Swoop6Updated 1
Did you miss ADA? Dont miss thisAda H&S worked perfectly, if BTC behaves nicely than this one should be your next setup. If you missed ADA H&S dont miss this.ZLongby LuTaKoS0
ZIL Finally Bottomed or Another DUMP coming?! Price Prediction!Price might go up from this support range to resistances Here we can see 2 Bottom Accumulation Patterns, how they work and develop check ideas below: Descending Wedge: Head and Shoulders: ZLongby ArtemFuturesTrading19
ZILLIQA LONG. Return of the ERC20sTrendmaster long stop on Zil. Two targets. Keep it simple ZLongby JedTrades4
ZILBTCZILBTC Entonnoir : W/D/H4 (swing) Oubli : il y a 3 jours j'ai également pris un trade sur la sortie de compression H4 qui a réintégré le dernier creux weekly (à ~459) et donc enclenché un biais haussier. C'était un trade assez risqué car pris sur un point de pivot sur une TF basse et just en-dessous d'une grosse zone de S/R. Reste à voir si on va casser la zone de S/R des ~500. SL à 446. ————— Funnel : W/D/H4 (swing) Forgot to tell : 3 days ago, I've also took a trade on the compression breakout on H4 that has reintegrated the last weekly top (at ~459) which started a bullish bias. This trade was pretty risky as it was taken on a pivot point on a low TF and right under a huge zone of S/R. Now, let's see if we can break the zone of S/R at ~500. SL set to 446.ZLongby Somstradamus3
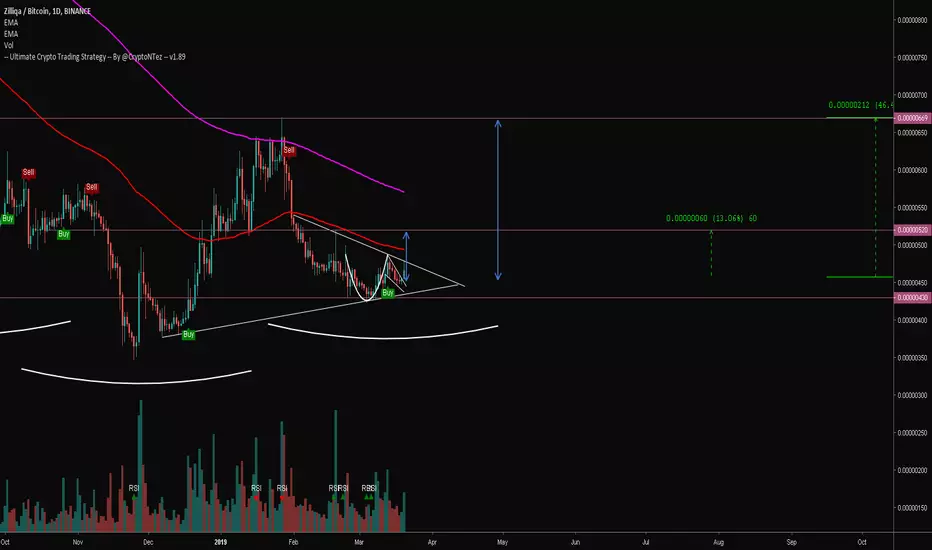
$ZIL Potential C&H on the daily and cross over EMA50... UCTS buy signal on the 1D MACD and RSI Rising Volume starting to rise Crossing above EMA50/100 could unleash a big uptrend movement.. For now wait for bigger confirmation(volume?) or enter with a SL... There is also a possibility of an Inv H&S on the weekly similar to what $ADA is displaying that can push price really high but it will take at least couple of weeks to confirm... Stay alert... Zby CryptoNTezUpdated 4
ZIL looking primed! ZIL has found a nice base here and might be ready to retest the local highs around 613 sats. Buy volume continues to come in and 100MA about to cross the 200MA! Thanks guys! ZLongby CM_Trades226
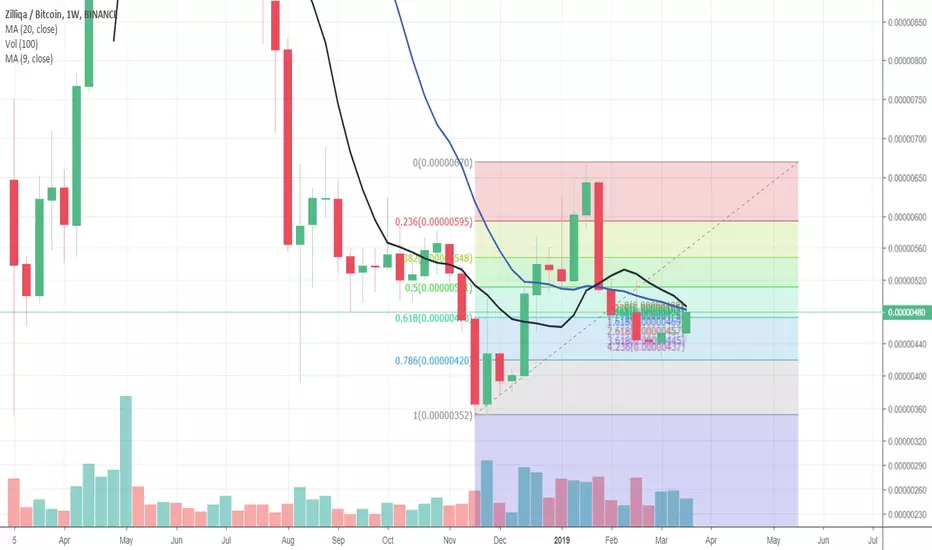
ZIL Close To Cross Up Ma9 And M20 (Week) At The Same TimeI believe in ma9 ma20 and ma50 (week) periods effect. If in the same time , the price cross up 2 ma, then price might increase fast. Look at the fibonacci resistance level. by fibonacci resistance level, there is lower risk. We will see what happen. ZShortby TraderMikabot1
There is a possibility for the beginning of an uptrend in ZILBTCTechnical analysis: . ZILLIQA/BITCOIN is in a range bound and the beginning of uptrend is expected. . The price is above the 21-Day WEMA which acts as a dynamic support. . The RSI is at 54. Trading suggestion: . There is a possibility of temporary retracement to suggested support zone (0.00000458 to 0.00000412). if so, traders can set orders based on Price Action and expect to reach short-term targets. Beginning of entry zone (0.00000458) Ending of entry zone (0.00000412) Entry signal: Signal to enter the market occurs when the price comes to " Buy zone " then forms one of the reversal patterns, whether " Bullish Engulfing ", " Hammer " or " Valley " in other words, NO entry signal when the price comes to the zone BUT after any of the reversal patterns is formed in the zone. To learn more about " Entry signal " and the special version of our " Price Action " strategy FOLLOW our lessons: Take Profits: TP1= @ 0.00000500 TP2= @ 0.00000576 TP3= @ 0.00000680 TP4= @ 0.00000684 TP5= @ 0.00000684 TP6= @ 0.00000832 TP7= @ 0.00000960 TP8= @ 0.00001130 TP9= @ 0.00001370 TP10= @ 0.00001610 TP11= @ 0.00001955 TP12= @ 0.00002393 TP13= FreeZLongby ForecastCity2216
ZIL Game PlanThis is gonna be key level indicators for grabbing swing trade. Call it a ZIL trade manual if you want ZLongby AbunduntiaTrades4