ZILBTC trade ideas


ZIL - BULLISH FOR 40% - 70% PROFIT - CryptoManiac101ZIL / BTC TA
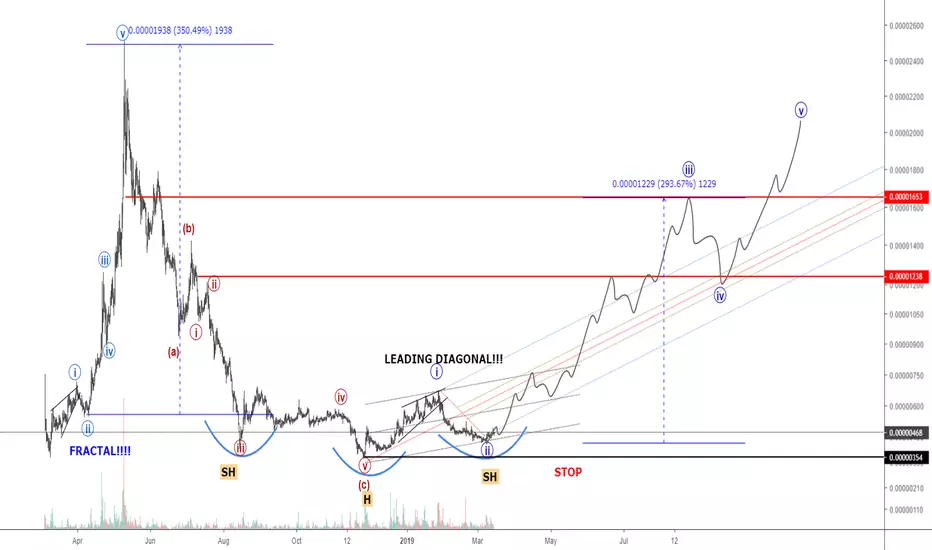
We are in bullish cycle for ZIL - profit of over 40% is likely in this trade - profit stop losses to be used

ZILLIQAJust yesterday, the coinmarketcap published a new rating of projects. The results are set on a scale from 0 to 1000 points and have the corresponding letter grade.
With the help of the rating it is impossible to fully evaluate projects and compare them. When analyzing a project, you should definitely conduct your own research.
Their rating will allow you to simplify the market navigation, assess the performance and achievements of the project.
Bitcoin, by the way, scored 887 points in this rating and received an A grade.
Zilliqa is also not lagging behind, the project got 787 points
For the past two weeks, the project team has focused on technical settings, as they approach the full-scale deployment of the Zilliqa Core Network.
We are waiting for the announcement of the move tokens ZIL from the team, it should appear very soon
technical analysis
We in bottom. ZILBTC formed up trend channel and now we near support line of this channel this is the best position for swing trading - position trading.


Zilliqa ($ZIL)Clear inverse H&S and a little bullish divergence playing out here. With Zilliqa's official mainnet launch on March 31st, it's safe to say this looks primed for a leg up as it has been trending down recently.

ZIL on Hourly, AB=CD Pattern + Double top?Hey everyone, today I bring you a ZIL/BTC chart on the hourly.
As you can see, We have formed a AB=CD pattern , although it's not perfect (see on google the proper fib levels) , it's quite good, as the point C is close to the 61.8 fib (it went to the golden pocket (61.8-65) ) , and the point D is at 1 (Length from A to B, dragged to C) .
By doing the AB=CD pattern, the minimum target is point C.
We can also see that it's forming a double top , it just needs to break 449 to confirm it.
The target for the double top is exactly the 1.272 fib target of the short!
If we look at the Daily of ZIL, and draw a fibonacci retracement, the 78.6 fib is in a cluster with the 1.618 target of the short!
Be prepared guys, now it's up to you how you chose your sell target!
Either choose:
1) Point C which is the 1 fib target in conjunction with the golden pocket.
2) Fib 1,272 in conjunction with the target of the double top(if confirmed).
3) Fib 1.618 in conjunction with the 78.6 fib retracement on the daily.
Caution: After the target is reached, it doesn't mean you should go long! It can go sideways for a while, when it turns bullish I will update and post a new chart.
If you want to share your ideas , comment down below and like if you enjoyed this analysis.
Disclaimer: I'm not a financial adviser , i'm not responsible for any losses due to following my chart analysis!


zil-btc signalBuy around : 450 - 460
EXCHANGE: #binance
Target 1: 500
Target 2: 570
Target 3: 620
Target 4: 670
STOP: 430


ZIL-BTC Long Trade PlanCommodity : ZILLIQA
Trade Type : LONG
Trading Against : BITCOIN
Entries : Double-UP Entries throughout the Buy Zone
Profit Taking : 25% at each TP point
Profit Locking : Move SL to break even once TP1 is hit, to TP1 once TP2 hits, to TP2 once TP3 hits and so on
Duration - 1-4 weeks
Investment in trade : 15% of the total Trading Balance.
Prospective Profit : 5% to 14%
Prospective Loss : 3%
RRR : SL to TP1 is 1.6, SL to TP2 is 2.5 , SL to TP3 is 3.3 and SL to TP4 is 4.6
Buy Zone/TPs/SL price points are marked in the chart as follows
Greens - Profit Targets (TPs)
Blue - Buy Zone (Entries)
Red - Stop Loss (SL)


ZILLIQA to 0.15 cents midtermZIL will be your biggest regret if you don't grab a bag for this upcoming altseason it will have a good run with the others & it's a obvious gold star pick up since we're at the bottom of the range. 4rm a technical standpoint chart looks beautiful with a ins H & SH bottom.
Positioned to go for 2x minimum in BTC pair.
ZIL VS BTC buying timeThis seems like a great short term buying opportunity as price has established higher highs and higher lows pattern.
What two resistance levels as they could act as a potential target.

There is a possibility for the beginning of an uptrend in ZILBTCTechnical analysis:
. ZILLIQA/BITCOIN is in a range bound and the beginning of uptrend is expected.
. The price is above the 21-Day WEMA which acts as a dynamic support.
. The RSI is at 51.
Trading suggestion:
. There is a possibility of temporary retracement to suggested support zone (0.00000458 to 0.00000412). if so, traders can set orders based on Price Action and expect to reach short-term targets.
Beginning of entry zone (0.00000458)
Ending of entry zone (0.00000412)
Entry signal:
Signal to enter the market occurs when the price comes to " Buy zone " then forms one of the reversal patterns, whether " Bullish Engulfing ", " Hammer " or " Valley " in other words,
NO entry signal when the price comes to the zone BUT after any of the reversal patterns is formed in the zone.
To learn more about " Entry signal " and the special version of our " Price Action " strategy FOLLOW our lessons:
Take Profits:
TP1= @ 0.00000510
TP2= @ 0.00000576
TP3= @ 0.00000680
TP4= @ 0.00000684
TP5= @ 0.00000684
TP6= @ 0.00000832
TP7= @ 0.00000960
TP8= @ 0.00001130
TP9= @ 0.00001370
TP10= 0.00001610
TP11= 0.00001955
TP12= 0.00002393
TP13= Free


Daily Bullish Signal $ZIL #ZIL #ZILBTC (14 March 2019)RED ARROW indicates the EXPECTED Time and Targets
Level Stoploss point up to maximize profit and reduce risk
I'm working all the time, even in Bearish Market


zilliqa bullish soon Zil/BTC 10%hi Guys urgent zilliqa in best pattern inverted head and shoulders and neck at 466s if we're break out the next target is 520 S
Good luck

