ZILLIQA, WHICH WAY?one of the more quiet projects in this space. Mainnet launch by March 31st with some big news. Expecting some movement soon.
$ZIL
$BTC
ZILBTC trade ideas

Zil is ready to fly...Hi
We have divergence on this chart.
As you see the B price is lower than A price but on the volume chart B price is upper than A price.
On the other side, the price has reacted on 78% Fibo.
Before getting any decision study about it.
Have a good time.


ZILBTC - private chart go public - right shoulder formedright shoulder been formed,
need to see if it is confirmed, otherwise, it would retrace down bit more.
if this is right shoulder, target as shown in the chart

Breaking from the descending channel... many signals Volume starting to appear. RSI rising from oversold levels.
MACD bull cross. UCTS Showing buy on the 6h,12h and soon 1D.
3D chart I can see a Wolf Wave pattern targeting for ~520sats level. RSI Bullish divergence..
Token swap on march 31...
you need more? #ZIL


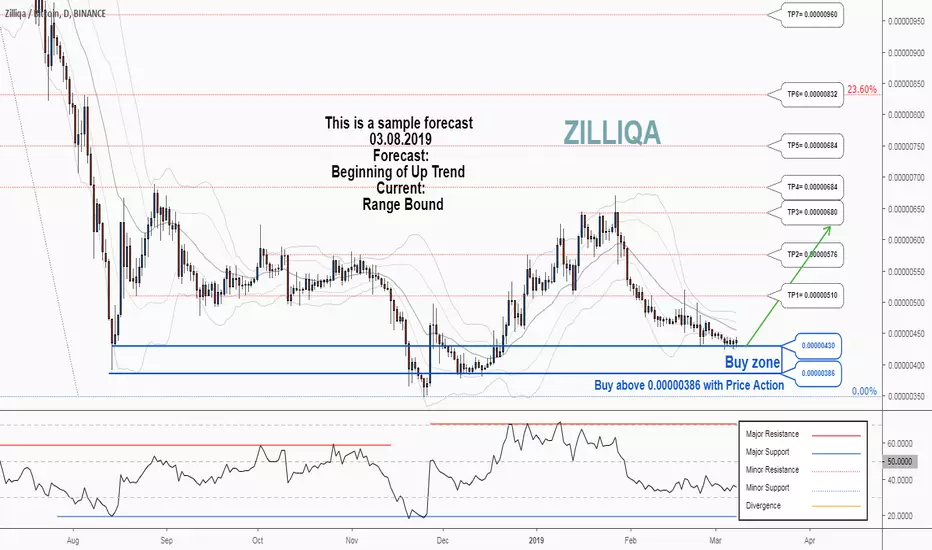
There is a possibility for the beginning of an uptrend in ZILBTCThere is a possibility for the beginning of an uptrend in ZILBTC
Technical analysis:
. ZILLIQA/BITCOIN is in a range bound and the beginning of uptrend is expected.
. The price is below the 21-Day WEMA which acts as a dynamic resistance.
. The RSI is at 34.
Trading suggestion:
. There is a possibility of temporary retracement to suggested support zone (0.00000430 to 0.00000386). if so, traders can set orders based on Price Action and expect to reach short-term targets.
Beginning of entry zone (0.00000430)
Ending of entry zone (0.00000386)
Entry signal:
Signal to enter the market occurs when the price comes to " Buy zone " then forms one of the reversal patterns, whether " Bullish Engulfing ", " Hammer " or " Valley " in other words,
NO entry signal when the price comes to the zone BUT after any of the reversal patterns is formed in the zone.
To learn more about " Entry signal " and the special version of our " Price Action " strategy FOLLOW our lessons:
Take Profits:
TP1= @ 0.00000510
TP2= @ 0.00000576
TP3= @ 0.00000680
TP4= @ 0.00000684
TP5= @ 0.00000684
TP6= @ 0.00000832
TP7= @ 0.00000960
TP8= @ 0.00001130
TP9= @ 0.00001370
TP10= 0.00001610
TP11= 0.00001955
TP12= 0.00002393
TP13= Free

ZILBTC - Revisiting - Buying again on dip 420 and belowIs history going to repeat ? We were right here
Let/s check, buying dips around 420 and below dwon to 350 ( please, please Money Management has to be in place ! )

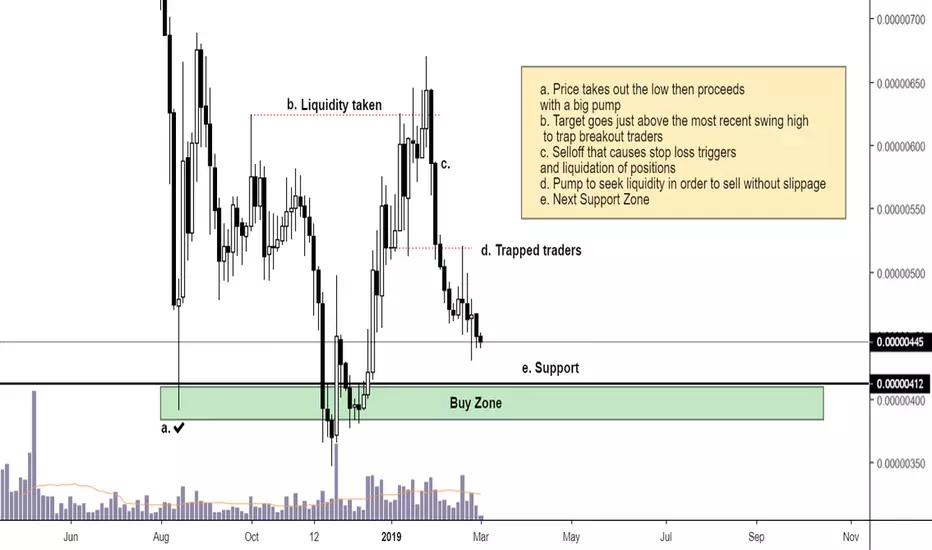
How altcoins pump - [Educational] - #TATipOn the chart there are notes that describe in detail a typical way that an altcoin pumps.
In this particular example we notice 5 phases that occured.
a. Price takes out the low then proceeds
with a big pump (Accumulation)
b. Target goes just above the most recent swing high
to trap breakout traders (Distribution)
c. Selloff that causes stop loss triggers
and liquidation of positions
d. Pump to seek liquidity in order to sell without slippage
e. Next Support Zone (Accumulation)


showing signals of a potential retrace..$ZIL showing signals of a potential retrace after this pullback of almost 30%.
RSI starting to rise from oversold levels.
MACD starting to turn to the bullish side UCTS still not flashing a buy signal (we need more volume).
Set alerts and accumulate under support if possible #ZIL


ZILBTC completed the cypher formationThe price action has formed a cypher pattern and entered in potential reversal zone.
In PRZ we already have a pivot 2nd support which will hel the price action in bullish divergence insha Allah.
The RSI is coming out from oversold condition at any time it can be strong bullish.
The targets are defined accordingly plz find on chart.
Regards,
Atif Akbar (moon333)

ZIL/BTC 1D DESCENDING SCALLOP,DIVERGENCES1) The stochrsi and price show divergence,2) The volume and price are diverging? (3)volume profile of scallop is U not dome wondering if divergence is an artifact of that,if indeed it is divergent?). Would normally say short however good indications of upwards progress soon,fundamentally wise mainnet token migration(1st April) lends itself to mid term uptrend possibly. Bear scenario pushes it to ATL most likely though possibly in range of previous bottom,forming the double bottom,scallop retracement puts it substantially lower.Orders at these levels depending on your strategy or when break up of scallop(filling price gap) confirms on the trendline,subsequent possible retracement or the same sequence but extending from new ATL or double bottom structure.

ZILBTC - ANOTHER CALL OF ZIL FOR PROFITBuy Price: Green Zone
TP: Blue Zone
Support: Orange Line
Resistance: Purple Line
SL: Red Zone (I don't recommend to sell in loss.)
Invest Suggestion: 20 Percent
Profit Expectations: 15 to 30%
See me previous analysis and how profitable the are!!!
Sell when you get some profit, according the way you trade.
Keep following us and please like this idea.
Any doubts? Send in the comments or in our telegram or Inbox here.
Thanks for visiting.

There is a possibility for the beginning of an uptrend in ZILBTCThere is a possibility for the beginning of an uptrend in ZILBTC
Technical analysis:
. ZILLIQA/BITCOIN is in a range bound and the beginning of uptrend is expected.
. The price is below the 21-Day WEMA which acts as a dynamic resistance.
. The RSI is at 35.
Trading suggestion:
. There is a possibility of temporary retracement to suggested support zone (0.00000436 to 0.00000392). if so, traders can set orders based on Price Action and expect to reach short-term targets.
Beginning of entry zone (0.00000436)
Ending of entry zone (0.00000392)
Entry signal:
Signal to enter the market occurs when the price comes to " Buy zone " then forms one of the reversal patterns, whether " Bullish Engulfing ", " Hammer " or " Valley " in other words,
NO entry signal when the price comes to the zone BUT after any of the reversal patterns is formed in the zone.
To learn more about " Entry signal " and the special version of our " Price Action " strategy FOLLOW our lessons:
Take Profits:
TP1= @ 0.00000510
TP2= @ 0.00000576
TP3= @ 0.00000680
TP4= @ 0.00000684
TP5= @ 0.00000684
TP6= @ 0.00000832
TP7= @ 0.00000960
TP8= @ 0.00001130
TP9= @ 0.00001370
TP10= @ 0.00001610
TP11= @ 0.00001955
TP12= @ 0.00002393
TP13= Free


ZIL/BTC bambolina still bullish acumulating modeacumulating zone wyckoff
tp 1 tp2 tp3
wait patiently
