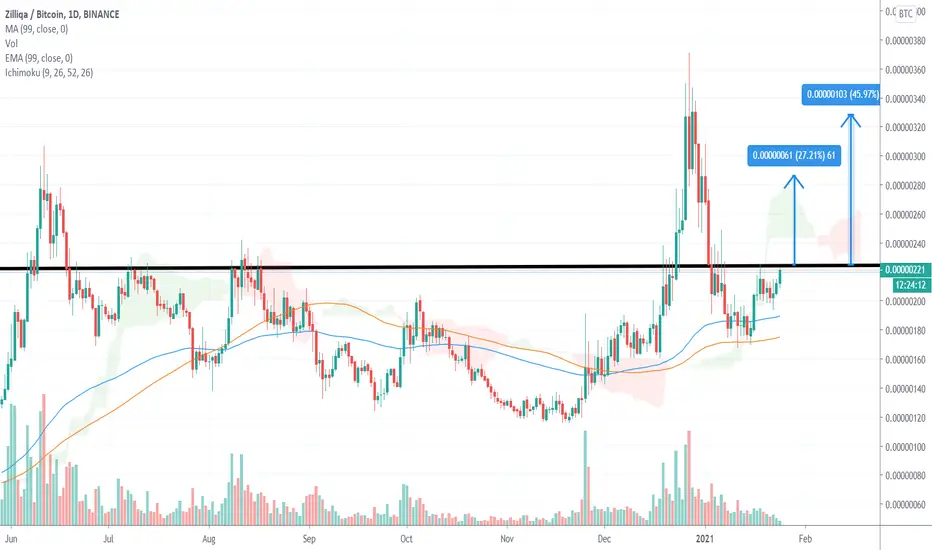
$ZIL, Volume increasing and looking strong..$ZIL
Printed a new 1D buy signal as it crossed over ~230 sats level..
Volume increasing and looking strong..
If manage to hold & push from here, then looking at ~270/320/350 sats as targets (back to '20 highs)
#ZIL
ZILBTC trade ideas

a thoughtRed lines: resistance
Dark green: trend lines
A little divergence on the rsi.
First target would be 350 sat if resistance of 169 sat holds.
Second target is 630 sat
Third target 1570 sat

ZIL BTC Moon Missionlook Juicy here
it can give you minimal 100%
Let see where it goes
DWYOR and Good Luck

Long term ZIL/BTCIt will take a while but, not an unprofitable investment to put your satoshis in here.
Cheers.

Waiting breakout soon for ZIL My rookie opinions for ZIL 4hr chart
I will wait ZIL long term
Thanks for watching

ZILBTC potential longHi guys, if you like this post, please support me by clicking the like and follow buttons and leaving a comment! Thanks!
DISCLAIMER: I am NOT a financial advisor and this post is NOT financial/investment/trading advice. I will not be responsible for any actions you take based on the analysis and comments that I provide. I am simply sharing what I am doing, and is not meant to be investment or trading advice. What you choose to do with the information that I provide is your own sole responsibility! The cryptocurrency market is extremely volatile, and you WILL lose all your money if you are inexperienced! DO NOT risk any money that you cannot afford to lose and always be cautious and manage your risk!
Please support me by liking, sharing, commenting, and following, and sharing your ideas and analysis below! Thanks!

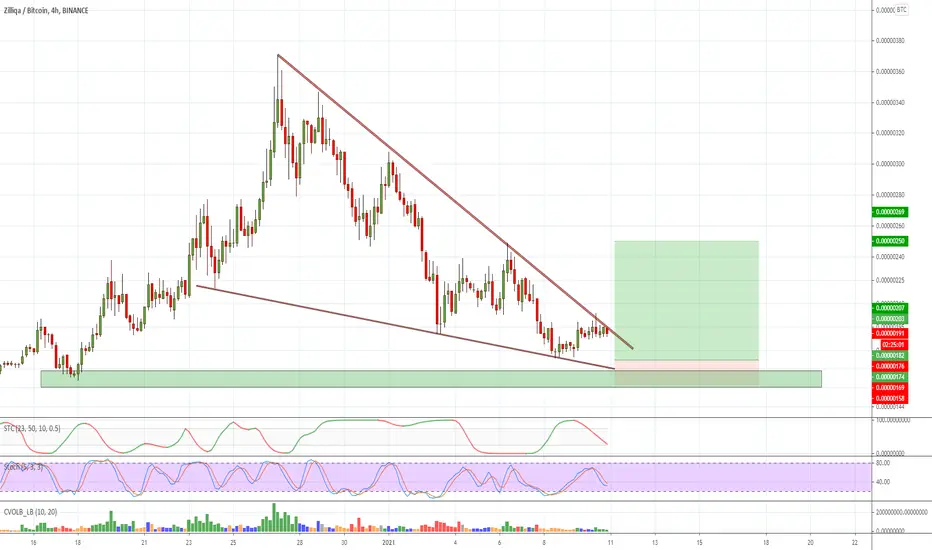
Crypto|ZIL/BTC|LongLong ZIL/BTC
Activation of the transaction only when the blue zone is fixed/broken.
The idea is to work out the resistance level .
* Possible closing of a trade before reaching the take/stop zone. The author can close the deal for subjective reasons, this does not completely cancel the idea and is not a call to the same action, you can continue working out the idea according to your data, but without the support of the author.
+ Maybe right now we will go even lower, then it's okay, the idea is not activated and simply canceled.
+ ! The zone highlighted by the ellipse is a zone of increased resistance, in this area a possible reversal for a correction is possible, please take this factor into account in this transaction.
The "forecast" tool is used for more noticeable display of % (for the place of the usual % scale) of the price change, I do not put the date and time of the transaction, only %.
Blue zones - activation zones.
Green zones - take zones.
The red zone - stop zone.
Working out the stop when the price returns to the level after activation + fixing in the red zone.
Orange arrow - the direction of take.
Blue arrow - neutral scenario without activating the trade.
The red arrow - the direction of the stop.
P.S Please use RM (risk management) and MM (money management) if you decide to use my ideas, there will always be unprofitable ideas, this will definitely happen, the goal of the system is that there will be more profitable ideas at a distance.


ZILBTC has confirmed a big breakoutBull flag and down channel:
On daily time frame chart, the price action of Zilliqa has formed a bull flag. This flag is in fact a down channel. Within this channel the price action has broken down the daily EMA 10 and 21 but having bounce from the support of channel. The volume is also decreased.
SMAs on daily chart.
On daily chart, the price action of Zil has broken down the 25 SMA and having good support of 50 simple moving average. The 50 SMA is at the same level where we have the support of the down channel.
EMAs on weekly chart.
On the weekly time period chart, the price action is testing exponential moving average 10 as a support.
Break out the down channel:
Now if we switch to the Zilliqa with Bitcoin pair, then on long-term weekly chart, it can be seen that the price action has broken out the down channel and after re-testing now the price action is likely to move up. It is quite good confirmation of a firm break out.
Conclusion:
On daily chart, the price action is behaving like a bull flag and in Bitcoin market it has broken out the big channel on long-term. Therefore it can be possible that now the priceline of Zilliqa will start a major move to the upside from here.

Short term trade on Zilliqa✅BINANCE:ZILBTC Falling wedge breakout and bounce off 100EMA. Expecting it to hit 3rd target.
Buy Zone was < 0.00000220
Target 1: 0.00000223
Target 2: 0.00000233
Target 3: 0.00000244
Stop Loss: 0.00000190
Follow for some 🔥 calls!

ZILBTC a mega bullish setupHey friends, hope you are well, and welcome to the new update on Zilliqa coin.
Bull flag and re-testing of a EMAs:
In USD market, on the daily time frame chart, the price action of Zilliqa has formed a bull flag and moving in a down channel. In the meanwhile, it is also using exponential moving averages with the time period of 10 and 21 as support.
Down channel has been broken out:
On the long-term weekly chart, the price action of Zilliqa coin with Bitcoin pair was moving in a down channel. Now the price line has broken out the resistance of this channel and re-testing the previous resistance as support to confirm this breakout. We also have 25 and 50 simple moving averages as support at the same level of support of the channel that was previously working as resistance. The 25 SMA also formed a bull cross with 50 SMA as well.
Ichimoku bearish cloud broken out:
On the same long-term weekly chart, in Bitcoin market the price action of Zil has also broken out the Ichimoku bearish cloud and now re-testing the previous resistance of cloud as support to confirm this breakout.
Big Shark move:
On the long-term monthly time period chart, the price action of the Zilliqa with Bitcoin pair has completed last leg of bullish Shark pattern and entered in potential reversal zone. 1st the priceline found a support at 0.00000050 btc and then found another support at: 0.000001150 btc . Simple moving average 7 is forming bull cross with SMA 25.
Conclusion :
As the priceline of Zilliqa has completed a very firm bullish setup in the Bitcoin market to move up against the BTC. Therefore, there are strong chances that the Zilliqa will also cross the previous high that Zilliqa set in the previous bull run.
For exact buy and sell targets for this trade, and other harmonic trading signals you can join:
www.patreon.com


ZILBTC | Possible Long ScenarioPossible long scenario for ZILBTC, the risk / reward are well worth it and therefore I opened a position.

Premium SignalI have marked this long on the basis of what I see in the short term, however there is currently potential for downward pressure against the BTC pair in the Mid Term TFs
As the Red RSI has closed in the 45 minute below 50 we are now in a race between the Energy in the 45 and the Red RSI in the 90. The Energy in the 45 needs to close above 50 before the Red RSI in the 90 crosses below 50 in order for us to see a possibility of a reversal to sustained upward pressure. In the 45 the Green MA and Red RSI are below 50, if they do not turn up, we are at risk of the price action dropping into at least the White/Aqua Bollinger Bands and probably the Aqua/Orange. We also have to be aware that the Blue LSMA in the 45 is very close to crossing below 50, this would mean we would stand a strong chance of the Bollinger Bands expanding and the price action to fall with it between the Aqua/Orange lower BBs. However the green has in fact turned up and the Red RSI has made contact as the Green is rising - this indicates upward pressure if it can close like this. The Green is higher than the Energy in the 3h & 6h which indicates bullish sentiment, it also looks as though it has a good chance of getting higher than the Energy in the 45. It is my opinion that the Energy will win the race and we can see a period of upward pressure. Although the Energy in the 12h is higher than the Green, we have seen the Green rise strongly with the Energy. We also have a "Premium Signal" in the 12h.
Premium Signal:
The Red RSI & the Blue LSMA have crossed above 50. If we close like this in 3h, there are high odds of the price action trading within the Aqua/Orange upper BBs. We are also likely to see the BBs start to expand because the Blue LSMA has crossed above 50. If I were trading this, I would consider opening a long position in the 12h & monitor it in your short term TFs.
Mid Term (3d, 6d, 9d & 12d)
We are also in a race between the Energy in the 3d & Red RSI in 6d.
We can also see potential for a period downward pressure as indicated in the 6d & 9d where we have closed with the Red RSI making contact with the Green as the Green falls.
If I were trading this, I may consider opening a margin long on short term TFs while looking for an entry for a short on mid term TFs
We need to keep an eye on the Blue LSMA in the 9d as it is turning down and we can already see the BBs begin to expand, unless it turns back up we are at risk of the BBs expanding and the price action to continue with candle bodies for the most part between the White/Aqua lower BBs as.
Trade safe
aBL
These are my opinions based on my interpretation of these indicators. I do not provide financial advice.

Can we transition to sustained upward pressureJust to point out, we are currently in a race between the Energy in the 3d & the Red RSI in the 4d.
The Energy in the 3d needs to close above 50 before the Red RSI in the 4d crosses below 50. If this happens we have a chance for reversal to sustained upward pressure.
Trade safe
aBL

ZILBTC - Potential Target 300 Satoshi & AboveBreakout and retest of previous downtrend + perfectly holding EMA 200 on 1D and EMA 100 on 3D chart.
Entry Point: 185 Satoshi
Potential Target: 300 Satoshi and above
SL: No
#HODL

Key levels for Zil over the next few daysZil has been following this uptrend & printing lower lows for around 14 months, we saw a huge parabolic run up to 280sats in June 2020 followed by the breakout of a 7 month long bull flag which saw us print a higher high of 330sats.
It seems like we've now found a strong support at just above 160sats & looks geared to make another move very soon if it continues along this trend, the key levels I'll be looking at for buy & sell opportunities have been mapped.
A breakdown of the curve would invalidate this idea, let me know your thoughts in the comments.

Zilliqa probable breakoutZilliqa had a long correction after last high and maybe now it's a time to recover. Daily macd shows that a trend can be reversed soon. Also I see a reversed head and shoulders on 1h. Also it's 4th attempt to break out from resistance. Also current price zone had a lot of volume in previous time so it's strong enough. I plan to watch on it and when break out is detected I plan to take it for long. No TA, I will find it later, Zilliqa is a good coin and it's possible to take it like that.
This is not a financial advice. I only share my own opinion about this.

Zilliqa breaking outGood risk/reward ratio on this ZILBTC pair. Targets and stop-loss are given.
inverted Head and Shoulders on 1H candles
it's just breaking out of this white trend line
Phoenix indicator: Positive White Energy AND Green Line above Energy (very good)
Bitcoin is stabilizing which is good for altBTC pairs
I appreciate if you press a like and don't forget to follow this idea because I will post updates on it.

📉 CryptoCurrency 🚀 ZIL / BTC 🚀BUY : 0.00000180 - 0.00000190
TARGET 1 : 0.00000204
TARGET 2 : 0.00000230
TARGET 3 : 0.00000250
Stop Loss : 0.00000160
Zilliqa 2021 Bull Run using BTC pairChannel and Beam Bands. POTENTIAL targets are between $1.75 all the way up to $8.

