$ZIL, Currently crossing above ~230 sats level w/ strong volume$ZIL
One of the few that has been pushing up since November against /BTC (HL-HH sequence similar to April '20)
Currently crossing above ~230 sats level w/ strong volume
A retest of crossed level as a R/S flip could allow some continuation confirmation prior higher targets
#ZIL
ZILBTC trade ideas

ZILBTC bounced of support once againZIl bounced of the support at the bottom of the channel multiple times
Buy near the bottom of channel
Target at the top of the channel
SL below support line (bottom of channel)
Not financial advise just my opinion

ZILBTC expecting continuation of upward pressure into JanuaryIn this update I'm looking at the 8 day timeframe only.
This update is to demonstrate the possibility of upward pressure continuing at least into the first week of January.
First of all we note in this timeframe that both the Red RSI & the Blue LSMA made contact with the Green MA while it was rising. This is a bullish sign. Although the White Energy is currently a fair bit higher than the Green, looking at lower timeframes I see a good possibility that the Green can go out to the side allowing the White Energy to fall below. It is important to note that this current 8 Day candle closes in 14 hours. The Red RSI is currently over 57. If the Red RSI can close above 56 in 14 hours this provides a good indication that upward pressure should continue in my opinion until the White Energy falls to around 80-85. If we look at the green vertical timeline at 9th June we can see that it was during this candle that the price action began to fall and the White Energy was at 80-85. Currently the White Energy is at around the same level as it was on the Blue timeline on 24th May. We can use this as a rough indication (considering similarities then with now) that the White Energy will fall to about 80-85 during the 8 day candle after the next. We could pinpoint this with greater acuracy by looking at lower timeframes - but its Christmas and I'm off to play with my son! Anyway I would estimate that we could be looking at upward pressure continuing on this basis for at least another 12 days IF THE RED RSI CAN CLOSE ABOVE 56 IN 14 HOURS.
This is my opinion and not financial advice
Merry Christmas guys!

ZILBTC still looking bullish in near term timeframesFurther to previous publications
As you can see, the Green MA is now higher than the White Energy in this set of timeframes 1d, 2d, 3d, 4d. This is a bullish sign. Furthermore in the 4d we can see that the White Energy has turned up with the Green moving strongly above. As predicted, the price action has already wicked above the upper red Bollinger Bands.
Currently I can see no clear indication of continuation or reversal in the higher timeframes but can see potential for them to develop bullish. We still need time and should concentrate on the near term timeframes for now. It is still possible we may see a repeat of the move from the 8th June - a strong pump marking the start of a reversal.
We do also have a possibility of the Red RSI closing above 56 in the 8d - this would provide a good indication of continuation until the White Energy drops below around 85-90 in this timeframe.
I am posting this just as an observation and marking it long for this set of near term timeframes only.
Personally this is a long term hold for me and I am not suggesting making any trading decisions based on this analysis.

Comparative ObservationFurther to my last comment that ZILUSD upward pressure would continue at least until Christmas.
Looking at this 6 day chart of ZILBTC I have placed a vertical timeline on May 24th.
You can see a virtually identical scenario with the indicators as present day.
We can see that the Green MA is about to move out to the side allowing the White Energy to fall below resulting in the green being higher than the Energy in this timeframe. The Red RSI is nearly at the same level and significantly higher than 50. The Blue LSMA is about to cross 50 - same as on 24th May. This indicates that the Bollinger Bands are likely to expand - we can already see this beginning to happen. Price action is already between the aqua/orange upper BB. As the BBs expand it looks like we could have a powerful move to the upside as we saw on 5th June. We have already seen the Red RSI & the Blue LSMA make contact with the Green & close as the green was ascending. This is Bullish . Obviously BTC can change all this, however despite it looking like there will be periods of downward pressure in BTC in shorter timeframes, the 12D still shows upward pressure. So I am reasonably confident that we may well see a powerful move from ZIL in the near term.
This is just an observation on a single timeframe and not a multi-timeframe analysis.
I am still learning these indicators so this is my opinion only and not financial advice.

Analysis mid term updateI have marked this update as Neutral as I cannot see any clear continuation or reversal signals and feel the charts need more time to develop.
But we need to be very cautious with the White Energy being higher than Green in these timeframes.
I am looking for continuation signals in mid term.
As previously stated I am still learning these indicators and presenting my best view on the basis of my limited knowledge.
In the 9 Day we can see that on 15th May, the Red RSI had not quite closed above 56 but was a bit more advanced than current day. We have 4 days and 8 hours left in this 9 day candle and although the Red RSI has crossed 50 it has not closed. We really need to see the Red RSI close above 56 (although 50 would be a good indication) to confirm continuation of upward pressure. The Blue LSMA has not yet crossed above 50, and we can see there is just a suggestion that the BB may start expanding. As current candle was already above BB basis, if this upward pressure manages to continue, if we compare price action with 02 June we could easily wick above the red upper BB. However, in this timeframe, the White Energy is higher than the Green MA. This indicates bearish sentiment...
...But when we compare current day with 24th May we can see that the Energy was higher than the Green and the price action closed higher in that candle. Current day we can also see there is a good possibility for the Green to go out to the side - for this to happen the price action needs to go sideways. Judging by what I can see in the 9D-2W timeframes in BTCUSD this scenario is possible.
It is key that the red RSI must close above 50 but ideally 56. If this happens and the Green MA moves out to the side & White Energy continues to turn down as on 02 June we should see upward pressure continue until the White Energy drops to around 80, at this point we would need to look at lower timeframes to time closing of positions if we are long.
The 12d tells a similar story, we need to be careful and must not ignore the White Energy being higher than the Green in these timeframes.
A new 2W candle started 17 hours ago and the Red RSI had not closed above 50. I would say we need to allow time for this to develop and should concentrate on the lower timeframes for now.
In my opinion it is key that the Green goes out to the side in the 6D we then have a chance for this position cascading into higher timeframes. Failing this we need to look at lower timeframes to assess continuation or reversal signals.

Zilliqa (ZIL) Going Straight Up!Zilliqa (ZILBTC) has been gaining upwards momentum after the 19-Nov. low... Going straight up.
On this chart, I mapped an ascending channel in light blue... Prices can continue growing especially if ZILBTC manages to stay above 0.00000213 today.
Both the RSI and MACD are looking pretty strong.
On a drop, support can be found around EMA10 or 0.00000190.
The next target is marked on the chart.
Namaste.


ZILBTC entryBe sure to get on the ZILBTC train, as it's retraced back to 0.618 fib level and bounced.

ZILBTC breaking out the cloud resistanceHey friends, hope you are well, and welcome to new update on Zilliqa coin.
The resistance of Wedge has been broken out:
Previously we have seen that the Zilliqa coin was at the resistance of a falling wedge pattern. Now if you will play the below chart, then you can see that finally, the price action of Zil has broken out the resistance of wedge.
The simple moving averages on daily and weekly time frame:
On daily chart, the price action has broken out the 200 simple moving average resistance after a lot of attempts since 25 Nov. Now the price line has strong supports of simple moving averages with the time period of 25, 50, 100 and 200.
Now at this time on weekly chart, the price action is breaking out the 100 simple moving average.
Breaking out the Ichimoku cloud:
Now on weekly chart, the price action of Zilliqa has found a bullish cloud resistance, before this it was weak bearish, so it was easy to breakout such cloud resistance therefore, now the priceline is breaking out the cloud. Once it will be broken out then Zilliqa can turn more strong bullish on long term.
Conclusion:
The price action has broken out the wedge on weekly chart and 200 SMA on daily time period. Now if on weekly chart, the Zilliqa will breakout the ichimoku cloud then we can observe a very long term bullish rally.

ZIL textbook setup?Everything just seems too good to be true on this chart at the moment. The descending wedge on the daily is formed almost perfectly with more than enough touches to be technically valid. The bottom of the wedge also corresponds nicely with the .786 fib and historical supports. There is plenty going on at this pivotal price level for ZIL. Note that the RSI is also very low. Potential profit on an entry now could have a 200% return, based on the size of the last run. I'm entering a long position now and will watch for any downward movement outside of that wedge just in case.


60-100% from my ZIL call ❤️ZIL / BTC
This idea is the result of
my previous call shared in 25 Nov.👇👇 :
price reached its med term target around 240 sats In less than 1 month
And in my channel i posted signal about it
If you followed this you should gain by now more than 60% profit in satoshi and in USDT(almost 100% 🤑)
I hope you enjoyed my signals and ideas
Good luck 🙏


ZilBtc trading opportunitySpotted potential Ascending triangle formation.
Kindly follow the suggested buy zone on the chart and always remember to apply stop loss according to our risk management.
Level to watch for are:
POSSIBLE ENTRY ZONE
Possible Support LEVEL
SELL TARGETS
Kindly go through the chart and do leave us your comments to let us know how you feel about our view,
Moreover REMEMBER to appreciate our effort with your likes and always subscribe(Click follow) to our profile for fast and quick daily updates on all our trading ideas
Thank you.

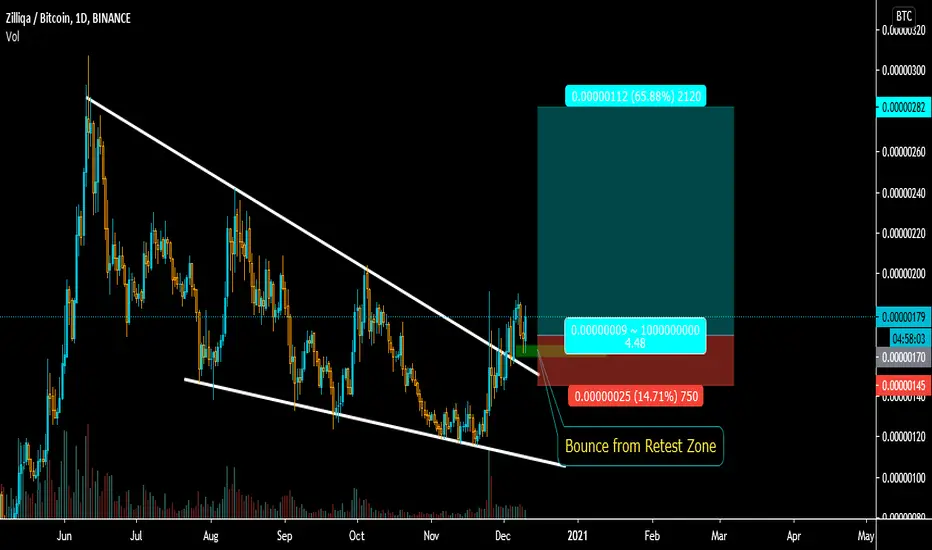
ZILBTC bounce off Retest zoneprice made the bounce from the retest zone it can move higher from here if hold above the 165 sats
you can enter here at 170 - 175
Stop : 145
Target : 195 , 225 , 260 , 350
ZILBTC - price bounced at bottom of channel - going up now!what are your thoughts on this? Let me know!
Not financial advise!

Number go upBounce from lows with volume, formed a falling wedge. Long the breakout, may not be retest given how strong the chart looks. May just end up going parabolic

ZIL/BTC target entryAnalysis of current trend of Zilliqa versus Bitcoin on Binance. Trend begins around the end of May until now. Red circle is target point of entry if current trend continues. We also have a confirmed breakout to the upside, ending a 6 month downtrend.

ZIL is ready to moonZIL managed to close above MA200 on daily timeframe, which is a major signal.
A retest around 173 is still possible, but I think that a big move is more around the corner.

ZIL / BTC is moving as expected ,can it reach next targets ?ZIL / BTC
hi guys
I want to share also this good coin Its going as my expectations until now
The buyers still has the upper hand here
And our long term targets still 240-300 sat
Reminder : this is old chart i already published two ideas before about it and we bought it early
Now we see the momentum
You can see here my first idea before breaking :
And second idea after the Breakout :
The price after breakout dropped exactly to buy area (retest)
And now go up follow my drawing
🚨NOTES :
1- for long term traders it can easily correct multiple times before reaching FINAL targets
2- The levels of fibonacci in my chart should hold inorder to continue for the next ones

Zilliqa is almost ready for a big movePreviously I posted an idea, in which the Zilliqa formed a bullish Shark. Now the idea has been executed and produced more than 64% rally so far.
Now, on weekly chart, the pricline of Zilliqa coin has been rejected by 100 SMA and also having good support of 50 SMA as well.
The priceline of Zilliqa has formed a falling wedge pattern on 7 days chart. And now likely to be rejected by the resistance. Therefore we can expect another retest of support before the breakout.
On daily chart, the price action has been rejected by 200 SMA. The 50 SMA is below the 200 SMA, if the 50 SMA will move up and form golden cross with 200 SMA then a breakout will be confirmed.
For a long time period the price action of Zilliqa is moving below the bearish cloud, now the cloud is weak therefore there is strong possibility for a powerful bullish rally soon.
