EYE ON ZILweekly price action on zil suggests an attempted break out
macd showing positive histogram and signal line crossover
NFA
ZILUSD trade ideas


ZIL to recover by 2022?Zilliqa is a pretty cool blockchain. With more dApps built on Zilliqa and more utility of $ZIL, we can expect the price of this asset to go back up to its previous highest price level. The journey is not going to be easy though as there are several strong levels of resistance.

Zilliqa Finally Ready To Show Its Strength?An update to my previous Zilliqa chart, we see we've developed a clear inverted head & shoulders pattern on the weekly chart. A break and close on the weekly chart above $0.03cents would likely trigger a rally to the yearly R3 pivot at $0.06cents.


$ZIL Impulse Wave (3) underway with target $0.0252.We finally have confirmation that $ZIL is no longer in a Wave (2) counter-trend pullback, that seemed never ending for all Zilliqans out there.
Much thanks to big brother Bitcoin's surge, $ZIL is now finally trading in a safe range where one can enter a trade and expect to go long.
An Impulse Wave (3) may be expected to go higher than our target but $0.0252 is a modest estimate for now.
Currently trading at $0.022, one can safely estimate to experience 13% gains by the end of this Impulse Wave (3).

ZILLIQA Cup & Handle?Looking at ZIL, we see a clear cup & handle formation on the weekly chart. A break and close on the weekly chat above $0.03cents would likely trigger a rally to the yearly R2 pivot at $0.06cents.

Understanding ZIL's overdue movementsThis isn't really a forecast or prediction, just a mere reflection of things for ZIl have played out in the last 7days.

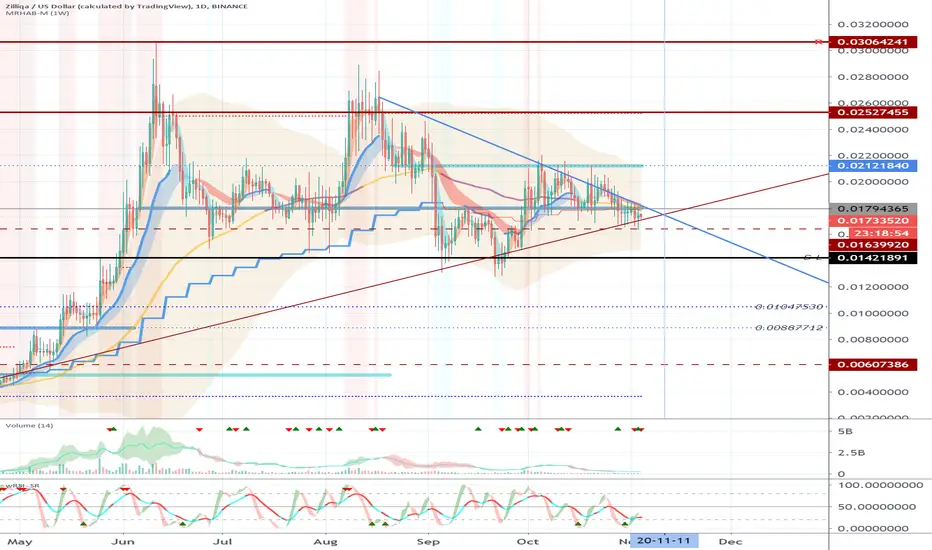
Zilliqa (ZIL) - November 4Hello?
Dear traders, nice to meet you.
"Like" is a huge force for me.
By "following" you can always get new information quickly.
Thank you for always supporting me.
-------------------------------------------------- -----
It remains to be seen if it can rise above the 0.01794365 point around November 11th, following the upward trend line.
If you gain support and rise at 0.01421891, it is expected to create a new wave.
-------------------------------------------------- -------------------------------------------
** Check support, resistance, and abbreviation points.
** Support or resistance is based on the closing price of the 1D chart.
** All explanations are for reference only and do not guarantee profit or loss on investment.
Explanation of abbreviations displayed on the chart
R: A point or section of resistance that requires a response to preserve profits
S-L: Stop-Loss point or section
S: A point or segment that can be bought for profit generation as a support point or segment
(Short-term Stop Loss can be said to be a point where profits and losses can be preserved or additionally entered through installment trading. You should trade from a short-term investment perspective.)
Updated: ZIL still bearish. Corrective wave C underway.Bearish market sentiments not helped by increasing fresh wave of Covid19 infections, lockdowns across the globe, and lack of stimulus.

Two ways to view Zilliqa's $ZIL today: Bulls & BearsIF YOU ARE BULLISH:
- Expect bounce of support at $0.017 to go on an impulse (minor) wave 3 climb.
- ZIL to reach between $0.021 to $0.0232 in the short term
IF YOU ARE BEARISH:
- Expect to break support level and go lower than $0.017 as ZIL continues a protracted countertrending (intermediate) wave 2
- aka an extended corrective (minor) wave C
Takeaways:
- not sure if it's good to go LONG or SHORT until further confirmations
- sit tight and let the bears or bulls give you further clarity


.02 into $1, short term ascending triangleThis is the lowest you will ever see this coin in my opinion. Great entry point here, this will be comparable to uniswap once their etherum bridge is complete by end of 4th quarter. Smart guys with PHDs in computer science running the project. They listed a stable coin for the sigapore government on their blockchain. They lauched Zilswap 2 weeks ago and staking on their wallet yesterday. Love this project,theses guys tell u what they are gonna do and do it, big time hodeling for at LEAST a dollar here.
Good Luck


Bullish signs apparent HERE are resistance levels to watch forThe current situation:
1. Price action is now above all major moving averages with the latest one it just gotten above to be the 3D 21MA at about 0.0195 USD, which is a bullish sign. It is important to see if the price action closes above this moving average however as falling below it may change the situation.
The price action is still apparent within the roughly rectangle pattern, with resistance to be expected at about 0.275 USD and above, where the top trend line is.
2. Increasing buyer volume is trending with higher price action on the 6, 12HR and daily chart. This is a good signal as more buyers are still coming in to push the price higher.
3. Possible bearish divergence can occur on the 1, 4, 6, 12HR and daily chart so this may still signal a pullback if they play out.
*Thank you to those who donated, I very much appreciate it.
*Let me know in the comment section if you agree or disagree, would love to hear your ideas too.
*These are purely my speculations and not financial advice. You should always do your own due diligence before trading or investing.

Zilliqa | USD - Head and Shoulders IdeaOn the USD pairing, pretty interesting to see a (possible) perfectly horizontal neckline @ ~$0.027

