Now I understand.Now I understand
What you tried to say to me
And how you suffered for your sanity
And how you tried to set them free
They would not listen, they did not know how
Perhaps they'll listen now. Don Mc Lean
Yes, Now I am singing that song.
As this coin has been around such a short time, it is great to see it in action,
ready for the long term.
Don't worry. Be happy.
ZILUSD trade ideas

Huston, we have a problem.During the last 3 hours or so, US$345.000.000 Have made a quick exit from the ship.
There is not much we can say anyway.

ZILUSD Zilliqa could test ICO priceICO Token Price: 1 ZIL = 0.00381 USD (0.0000084656 ETH).
All-Time High (ATH): 0.23500 USD
Today:$0.010198 USD (-0.75%)

Zilliqa Price Analysis ZIL / USD: In The Bear’s JawsZilliqa / USD Short-term price analysis
Zilliqa has a bearish short-term outlook, with the cryptocurrency still trading below its 200-period moving average on the four-hour time frame.
The four-hour time frame shows that the ZIL / USD pair is attempting a bearish breakout from narrowing wedge pattern that has been in play since mid-July.
Technical indicators across the four-hour time frame are bearish and continue to issue sell signals.
Pattern Watch
Traders should expect a double-digit move in the ZIL / USD pair once a confirmed technical breakout occurs.
Relative Strength Index
The RSI indicator is bearish on the four-hour time frame and still shows scope for further downside.
MACD Indicator
The MACD indicator is bearish on the four-hour time frame and continues to issue a sell signal.
Zilliqa / USD Medium-term price analysis
Zilliqa has a bearish medium-term outlook, with the cryptocurrency continuing to trade below key technical resistance on the daily time frame.
The daily time frame continues to show the invalidation of a large inverted head and shoulders pattern, which is a significant bearish development over the medium-term.
The 50-day moving average has now crossed below the 200-day moving average, which is a heavily bearish trading signal.
ZIL / USD Daily Chart by TradingView
Pattern Watch
Traders should note that a neutral wedge pattern is also present on the daily time frame.
Relative Strength Index
The Relative Strength Index is rising on the daily time frame, although it remains technically bearish.
MACD Indicator
The MACD indicator is mixed on the daily time frame and is failing to provide a reliable trading signal.
Conclusion
Zilliqa may soon experience a strong technical breakout from the wedge pattern across both time horizons. Due to the overall bearish trend and the death cross in place on the daily time frame, a downward breakout is currently the preferred scenario.

Macrogalactic view.ZIL doesn't show to have the burden of a trillion tokens being pushed to the market each and every time price goes up a fraction, its fluctuation looks more like the effect of scalpers, not the ones of a bunch of Bears cashing out $$$$Xn.
With Cryptocurrencies, a different set of Caution Tool Box does apply.
If I were to buy with LONG TERM expectations, this would be one of my favorite LESS RISKY LOOKING one.
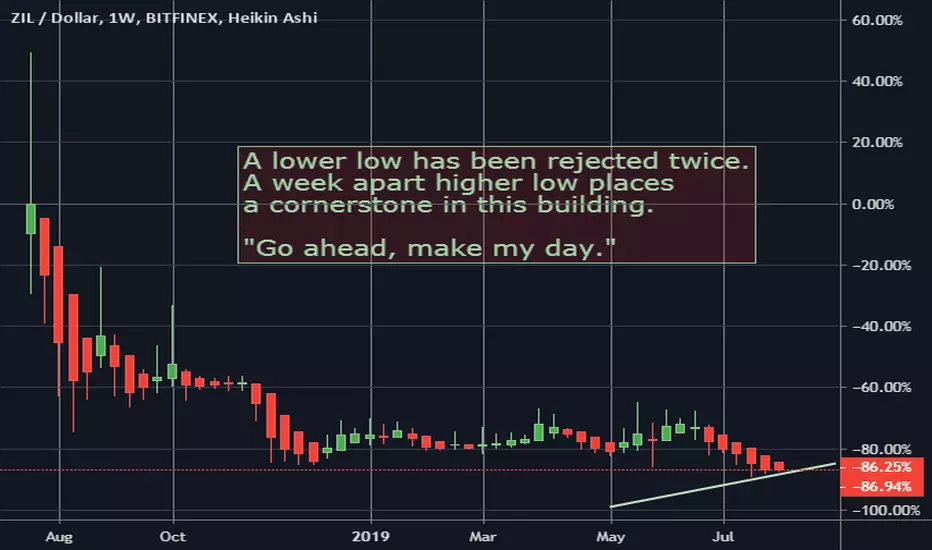
MicroscopeAfter a hard landing, it has just started to build up what it takes. Is this the right time and are we in the right place?
Zilliqa (ZIL) seems to be among the best in its field out there, wath out and do whatever you find out is good for you.

On the technical side of the money.ZIL -- has increased around 10% during the last 24 hours and holding up there.

Zilliqa Price Analysis ZIL / USD: Riding On ChainlinkFundamental Analysis
Zilliqa has gained bullish momentum after the project announced that it is planning to integrate Chainlink’s decentralized oracle solution. This will enable access to real-time information for Zilliqa’s smart contracts and expand the functionality of its network.
Zilliqa / USD Short-term price analysis
Zilliqa has a bearish short-term outlook, with the cryptocurrency still trading below its 200-period moving average on the four-hour time frame.
The four-hour time frame shows that despite the recent rally in the ZIL / USD pair, the price still remains trapped within a narrowing wedge pattern.
Technical indicators across the four-hour time frame are bullish and continue to issue buy signals.
Pattern Watch
Traders should note that a bullish wedge breakout will likely prompt an important test of the ZIL / USD pair’s 200-period moving average.
Relative Strength Index
The RSI indicator is bullish on the four-hour time frame, although it is starting to correct from overbought conditions.
MACD Indicator
The MACD indicator is bullish on the four-hour time frame and continues to generate a strong buy signal.
Zilliqa / USD Medium-term price analysis
Zilliqa has a bearish medium-term outlook, with the cryptocurrency still trading below key resistance on the daily time frame.
The daily time frame continues to show an invalidated inverted head and shoulders pattern, with the recent downside breakout yet to reach its bearish target.
Technical indicators on the daily time frame are attempting to turn bullish and are currently failing to generate a clear trading signal.
ZIL / USD Daily Chart by TradingView
Pattern Watch
Traders should note that a wedge pattern is also present on the daily time frame.
Relative Strength Index
The Relative Strength indicator is rising on the daily time frame, although it still remains technically bearish.
MACD Indicator
The MACD indicator is rising and is now starting to generate a buy signal on the daily time frame.
Conclusion
Despite the recent upside move, Zilliqa still remains in a vulnerable position technically across the four-hour and daily time frame.
The invalidation of the bullish pattern on the daily time frame suggests that the ZIL / USD pair has yet to find a meaningful price floor.

Zilliqa poised to become global advertising blockchainCredit to: Andrew Munro
Posted: 30 July 2019 10:01 am
It's worth stepping back and looking at the sheer scale of the client base Aqilliz is likely to serve, directly and indirectly.
Aqilliz's CEO from October this year will be Gowthaman "G'Man" Ragothaman, former global client lead at WPP, the world's largest advertising company. Based on the precedent on which Aqilliz is built, and on the fact that Ragothaman is its CEO, Aqilliz could be envisioned as something of a to-market version of the successful Project Proton trial.
Mindshare, whose clients include PepsiCo and many more, is a WPP subsidiary, as is GroupM, where Ragothaman was heading up blockchain initiatives. Elsewhere in the supply chain, Project Proton included the MediaMath real-time ad-buying platform, which describes itself as "trusted by two-thirds of the Fortune 500", and the Rubicon Project ad exchange, which processes ads across millions of websites.

longwe have a bullish divergence (red and green arrows).
a buy signal on the macd
the price will hit the green line to test it as a resistance line.


Possible Bullish Continuation Pattern for ZILLIQARecent Blockchain (2017), but already in the Top 50 of coinmarketcap,
ZILLIQA distinguishes itself by its advanced technologies:
- Sharding: intelligent division of workload between minors
- "home" language supposedly more efficient for its Smart Contracts
I didn't buy ZIL in 2018 because I found it overvalued with regard to its strong supply of about 1 Billion, but its strong retracement as on the majority of the crypto-market makes it today seems particularly interesting in terms of risk-reward
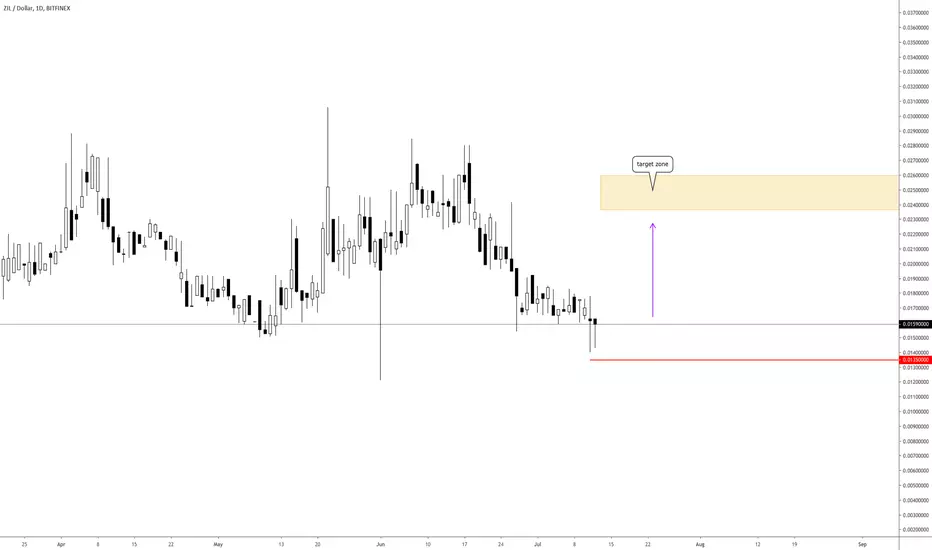
My opinion is of course supported by chartism in progress, which seems to be now in a Symmetrical Triangle of continuation with target at $ 0.03
The volume analysis corresponds to the rapid rise then slow decline typical of symmetric triangles:
we must now monitor the rise in future volumes, necessary for a bullish breakout
The RSI 14 indicates a recent overselling that is a priori auspicious for the future (see the precedents that I highlighted on this indicator)
This remains a trade "high risk high reward", so in your soul and conscience after thorough study of fundamentals, team / community / partnerships, etc. You alone are responsible for your investments, good luck to all!

Zilliqa Price Analysis ZIL / USD: Prison Break, Round 2Fundamental Analysis
Zilliqa continues its move up after the project announced that it has enabled smart contracts. This opens the platform for a wide community of dApp developers, and could catalyze ecosystem growth with dApps development.
Zilliqa / USD Short-term price analysis
Zilliqa has a bullish short-term outlook, with the cryptocurrency still trading above its 200-period moving average on the four-hour time frame.
The four-hour time frame shows that a large inverted head and shoulders pattern has formed, with the ZIL / USD pair now slipping away from key neckline resistance.
Technical indicators across the four-hour time frame are neutral and are currently failing to generate a clear trading signal.
Pattern Watch
Traders should note the October 5th, 2018 swing-high is the overall upside target of the inverted head and shoulders pattern on the four-hour time frame.
Relative Strength Index
The RSI indicator is also neutral on the four-hour time frame and is highlighting the current indecision towards the ZIL / USD pair in the short-term.
MACD Indicator
The MACD indicator is neutral on the four-hour time frame and is failing to generate a clear trading signal.
Zilliqa / USD Medium-term price analysis
Zilliqa has a bullish medium-term outlook, with the cryptocurrency pressing against key trendline resistance on the daily time frame.
The daily time frame is showing that the ZIL / USD pair is now trading towards the top of a horizontal price channel, with bulls so far failing to perform a range breakout.
Technical indicators on the daily time frame remain bullish and continue drift higher.
ZIL / USD Daily Chart by TradingView
Pattern Watch
Traders should monitor daily price closes above the horizontal price channel as it will likely signal a major sentiment shift towards the ZIL / USD pair.
Relative Strength Index
The Relative Strength indicator is bullish on the daily time frame and still shows scope for further upside.
MACD Indicator
The MACD indicator is bullish on the daily time frame and continues to generate a buy signal.
Conclusion
Zilliqa remains on the cusp of a technical breakout on both time horizons, with the recently created bullish pattern on the four-hour time frame highlighting the potential path ahead.
If a technical breakout fails to occur on the daily time frame, sellers may start to force the ZIL / USD pair back towards its 200-day moving average.

Zilliqa- Massive head & Shoulders formationZilliqa's big smart contract capability release is in a couple days and the chart is set to pump to levels not seen since last fall- nice.
DYOR

Zilliqa Price Analysis ZIL / USD: Approaching BreakoutZilliqa / USD Short-term price analysis
Zilliqa has an increasingly bullish short-term outlook, with the cryptocurrency testing towards the April 2019 trading high.
The four-hour time frame is showing that a large inverted head and shoulders pattern has formed, with the recent advance invalidating a bearish head and shoulders pattern.
Technical indicators across the four-hour time frame have turned bullish and continue to generate a strong buy signal.
Pattern Watch
Traders should note the upside target of the inverted head and shoulders pattern on the four-hour time frame would take the ZIL / USD pair towards levels not seen since October 2018.
Relative Strength Index
The RSI indicator is bullish on the four-hour time frame and still shows scope for further upside.
MACD Indicator
The MACD indicator is bullish on the four-hour time frame and continues to issue a strong buy signal.
Zilliqa / USD Medium-term price analysis
Zilliqa has a bullish medium-term outlook, with the cryptocurrency on course for a technical breakout on the daily time frame.
The daily time frame is showing that the ZIL / USD pair is testing towards the top of a horizontal price channel that has been in place since the start of 2019.
Technical indicators on the daily time frame remain bullish and continue to issue a buy signal.
ZIL / USD Daily Chart by TradingView
Pattern Watch
Traders should note that a sustained bullish breakout above the horizontal price channel will trigger a major sentiment shift towards the ZIL / USD pair.
Relative Strength Index
The Relative Strength indicator is bullish on the daily time frame and still shows scope for further upside.
MACD Indicator
The MACD indicator is bullish on the daily time frame and is still issuing a strong buy signal.
Conclusion
Zilliqa is starting to appear increasingly bullish over both time horizons, with both the four-hour and daily time frames highlighting that the ZIL / USD pair is close to a technical breakout.
If a technical breakout is confirmed, the ZIL / USD pair could rally towards levels not seen since October 2018.

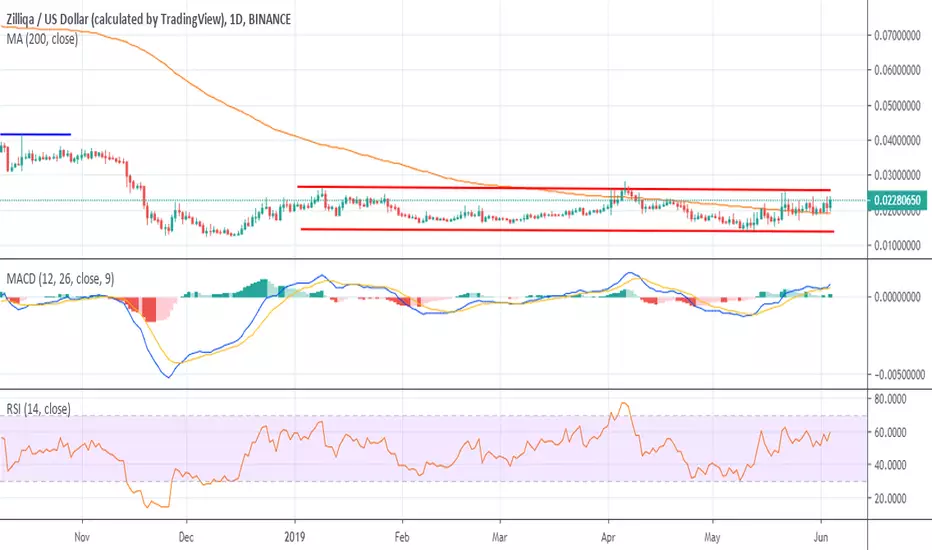
ZIL POSITIVE TREND DEVELOPMENTSnew trading patterns suggest that ZIL may be ready to swing to the upside

ZIL RANGE TRADING SHAKE OUTtrading in a tight range to shake out the last possible weak hands
once this box is broken the upper range of .09 is the next likely shake out

Good chance zilliqa pops soon (x2)Stuck in wyckoff accumulation pattern. Currently building an ascending triangle, if breakout occurs the price of zilliqa might double.

Zilliqa Price Analysis ZIL / USD: Escaping With The GoodsZilliqa / USD Short-term price analysis
Zilliqa has a bullish short-term outlook, with the cryptocurrency still trading well above its 200-period moving average on the four-hour time frame.
The four-hour time frame shows that price has bounced sharply higher from the ZIL / USD pair’s 200-period moving average and is now testing back towards the neckline of an inverted head and shoulders pattern.
Technical indicators across the four-hour time frame have turned bullish and continue to generate a buy signal.
Pattern Watch
Traders should note that an even larger inverted head and shoulders pattern could start to form on the four-hour time frame.
Relative Strength Index
The RSI indicator is bullish on the four-hour time frame and is highlighting the growing short-term bullish pressure.
MACD Indicator
The MACD indicator is bullish on the four-hour time frame and continues to issue a strong buy signal.
Zilliqa / USD Medium-term price analysis
Zilliqa has a bullish medium-term trading bias, with the cryptocurrency recovering back above its trend defining 200-day moving average.
The daily time frame is showing that the ZIL / USD pair remains trapped within a large horizontal price channel that has been in place since the start of 2019.
Technical indicators on the daily time frame remain bullish and continue to show scope for further upside gains.
ZIL / USD Daily Chart by TradingView
Pattern Watch
Traders should note that the October 2018 swing-high is the projected bullish target if a technical breakout occurs from the horizontal price channel.
Relative Strength Index
The Relative Strength indicator is bullish on the daily time frame and continues to issue a buy signal.
MACD Indicator
The MACD indicator is bullish on the daily time frame, with the MACD signal line still issuing a buy signal.
Conclusion
Zillaqa remains well supported on any moves lower, with the bullish pattern on the four-hour time frame highlighting that the cryptocurrency can still trade much higher over the short-term. If ZIL / USD bulls can ignite the bullish pattern it is likely that we will see a technical test towards the top of the horizontal price channel on the daily time frame.
I see Zil probably making a bottomAs Zilliqa makes a low in btc and has a slight divergence on the RSI i see great upward potential.
Possibly bottoming out & Starting a new weekly uptrend.
