ZILUSDT 1W Analysis ZIL ~ 1W Analysis
#ZIL If you still have confidence in this coin, maybe you can consider this support to start buying back from here with a short-term target of at least 20%++
ZILUSDT trade ideas

#ZIL/USDT#ZIL
The price is moving within a descending channel on the 1-hour frame, adhering well to it, and is on its way to breaking it strongly upwards and retesting it.
We are seeing a bounce from the lower boundary of the descending channel, which is support at 0.01200.
We have a downtrend on the RSI indicator that is about to break and retest, supporting the upward trend.
We are looking for stability above the 100 moving average.
Entry price: 0.01258
First target: 0.01317
Second target: 0.01370
Third target: 0.01430

ZILUSDT: The Sleeping Giant Awakens with a 20% Surge!
📊 Chart Breakdown:
- Current Price: $0.0144
- Volume: 51.96M (Growing interest! 🐋)
- Key Levels:
- Support: $0.014 (Recent bounce zone!)
- Resistance: $0.020 → $0.025 → $0.060 (ATH retest!)
🔥 Creative Analysis:
ZIL just shocked traders with a 20%+ pump, breaking out from its long-term accumulation zone. The 51.96M volume spike suggests this could be the start of a bigger move.
🎯 Big Idea:
"The ZIL Quantum Leap" ⚛️
- Entry: $0.0144 (Aggressive) or $0.0120 (Safe pullback)
- Targets: $0.020 → $0.025 → $0.035 (Mid-term) → $0.06 (ATH retest!)
- Stop Loss: Below $0.0091 (Only for risk-takers!)
💡 Why This Works:
- Oversold Bounce: From $0.0091 to $0.0144 (+58% from lows!)
- Volume Confirmation: 51.96M volume = Real buying pressure
- Narrative Potential: ZIL's tech is undervalued in 2025's blockchain landscape
🚨 Meme-Worthy Twist:
"ZIL isn't just waking up - it's entering HYPERSPACE! 🌠 Miss this launch and you'll be watching from Earth."
📌 Final Thought:
This could be ZIL's comeback story. If it holds $0.014, we might see 2-4x in the coming weeks. The risk/reward here is stellar!
👍 Like & Follow for more high-potential setups! #ZIL #SleepingGiant #AltSeason2025
---
DYOR – this isn't financial advice, it's cosmic-level opportunity spotting! 🪐

ZILUSDT 1D AnalysisZIL ~ 1D Analysis
#ZIL Buy when re -testing this support block or buy after successfully penetrating this resistant line with a short -term target of at least 10%+.

Zilliqa: Your Altcoin Choice (S2)The growth face starts now. Look at it this way, ZILUSDT produced a low in September 2023, less than a year old and this led to a bullish wave. Then in August 2024 there was another major low, 11 months old and this too led to a bullish wave.
We are now in April 2025 and last week ZILUSDT produced another low, this time 8 months old and this one will not lead to a bullish wave. This major low, a new All-Time Low, signals the start of the 2025 bull market. Maximum growth starting today.
A full bullish cycle can take months to develop and sometimes years. That is to say that the market can take its time to grow. At first, we will see some big green candles followed by some retraces that end in a higher low. After 1-2 months, there will be a strong advance and then a correction of medium size, followed by additional growth.
The correction that started in early December 2024 is already over. After a correction, what follows is a bullish impulse. This means long-term growth.
Get ready and be prepared. Prices are good now, the best possible. Buy when prices are low.
Get ready and be prepared because once the action starts there is no going back. Once the first jump is in, low prices will be no more. Look at the STRAXUSDT and GASUSDT publications in my profile for additional information.
» Rest easy and be certain that your Altcoin Choice will grow. Zilliqa is going up. Patience is key, but doubt is zero. 100% certainty.
Thanks a lot for your support.
I hope you enjoy the analysis.
Namaste.

#ZIL/USDT#ZIL
The price is moving within a descending channel on the 1-hour frame, adhering well to it, and is heading for a strong breakout and retest.
We are seeing a bounce from the lower boundary of the descending channel, which is support at 0.00930.
We have a downtrend on the RSI indicator that is about to be broken and retested, supporting the upward trend.
We are looking for stability above the 100 moving average.
Entry price: 0.01030
First target: 0.01075
Second target: 0.01111
Third target: 0.01153

ZIL Descending channelPrice keeps grinding to the downside, forming the green channel.
A break of the channel should lead us first to a test of blue resistance, followed by gray resistance.
Price is showing divergence in smaller timeframes, but this is not enough to consider a reversal.

ZILUSDT 1WZIL ~ 1W Analysis
#ZIL Buy gradually from here if you still have a Conviction on this coin with a short -term target of at least 20%+.

$ZIL is sitting on a strong!GETTEX:ZIL is sitting on a strong long-term support line
Every touch in the past led to a solid move up.
Now back at the same zone — eyes on a potential bounce toward $0.02–$0.03.
Retweet if you're bullish!
#Altcoins #Crypto

Zilusdt swing Quick LongZilusdt is looking good for a long here .
holding the price and it can smash into the resistance and most probably hit the 0.01800.
kinda risky looking at the btc PA but taking it with a tight invalidation.
high Risk Hhigh RR
adding leveraged longs around 0.01300 DCA.
Targeting 0.01800 can be extended too if a pump happened.
tight stops at 01275-80
Note: Not a financial advice

ZILUSDT at a Breaking Point: Deeper Drop or a Surprise Reversal?Yello! Is ZILUSDT about to sink further, or are the bulls preparing for a comeback? The price action is flashing critical signals, and a major move is brewing traders, stay sharp.
💎#Zilliqa remains under heavy bearish pressure, struggling to reclaim the key $0.01503 resistance level. The price is trading below both the 50 and 200 EMAs, reinforcing the downtrend and showing that sellers are still in control. If GETTEX:ZIL fails to hold above the current trendline, it will likely retest $0.01278, where a rejection could send it lower. Until $0.01503 is reclaimed and sustained, the risk of further downside remains high.
💎The next major support sits at $0.01032, where a temporary bounce could occur. This is a crucial level, as it marks a strong historical support zone. However, if selling pressure persists, ZIL could drop further to $0.00879, a key accumulation area where bulls might step in—or where the bearish trend could deepen even further.
💎For the bulls to regain control, it must reclaim $0.01503 and break past the supply zone. A sustained push beyond this level, backed by strong buying momentum, could hint at the start of a trend reversal. However, a true shift in momentum will only be confirmed if ZIL closes above $0.01503, reclaims the 200 EMA, and invalidates the current bearish setup.
Patience is everything, traders. The biggest profits come from waiting for confirmation, not chasing every small move. Play it smart and stay disciplined only the prepared will win in the long run.
MyCryptoParadise
iFeel the success 🌴

ZIL/USDT 1W 🩸 GETTEX:ZIL ⁀➷
#Zilliqa. Macro chart Another
💯 Intermediate Target - $0.051
🚩 Macro Target 1 - $0.071
🚩 Macro Target 2 - $0.110
🚩 Macro Target 3 - $0.161
- Not financial advice, trade with caution.
#Crypto #Zilliqa #ZIL #Investment
✅ Stay updated on market news and developments that may influence the price of Zilliqa. Positive or negative news can significantly impact the cryptocurrency's value.
✅ Exercise patience and discipline when executing your trading plan. Avoid making impulsive decisions driven by emotions, and adhere to your strategy even during periods of market volatility.
✅ Remember that trading always involves risk, and there are no guarantees of profit. Conduct thorough research, analyze market conditions, and be prepared for various scenarios. Trade only with funds you can afford to lose and avoid excessive risk-taking.

ZIL: Awaits a Major MoveIn this analysis, I will be reviewing the ZIL coin, one of the Layer 1 projects primarily focused on payments.
📅 Weekly Timeframe
In the weekly timeframe, we observe a ranging box following the downtrend from the 0.01536 peak. The lower boundary of this range is at 0.01282, while the upper boundary is at 0.03472.
🔍 During Bitcoin’s last bullish move, this coin also bounced from the lower boundary and moved toward the upper boundary. However, as Bitcoin entered consolidation within its own range, this coin started to decline and has now returned to the lower boundary.
💫 If the price establishes itself below the range, we will likely see the next leg of the downtrend and a new bearish trend forming.
📊 However, if the lower boundary provides strong support and holds the price above this area, a move toward the upper boundary—and potentially a breakout—could occur.
⚡️ If the lower boundary is broken, the price target would be 0.03472, and further resistance levels at 0.06017 and 0.15361 could be tested.
📅 Daily Timeframe
In the daily timeframe, we can analyze price movements in more detail. As seen, after reaching the upper boundary of the range and getting rejected, the first bearish leg took the price down to 0.02034. Following a consolidation phase and a brief support at this level, the price broke below and completed the next bearish leg down to the lower boundary.
✨ Currently, market volume has significantly decreased, indicating that a major move is approaching. If the lower boundary is broken, the price may continue its next bearish leg downward.
🔼 For a long position, the first confirmation of a trend reversal would come after a breakout above 0.01635, though this is a high-risk trigger. The main confirmation for trend reversal currently stands at 0.02034.
💥 On the other hand, the key resistance remains at the upper boundary of the range. A breakout above this level would confirm a fully bullish trend.
📝 Final Thoughts
This analysis reflects our opinions and is not financial advice.
Share your thoughts in the comments, and don’t forget to share this analysis with your friends! ❤️

TradeCityPro | ZIL: Awaits a Major Move👋 Welcome to TradeCity Pro!
In this analysis, I will be reviewing the ZIL coin, one of the Layer 1 projects primarily focused on payments.
📅 Weekly Timeframe
In the weekly timeframe, we observe a ranging box following the downtrend from the 0.01536 peak. The lower boundary of this range is at 0.01282, while the upper boundary is at 0.03472.
🔍 During Bitcoin’s last bullish move, this coin also bounced from the lower boundary and moved toward the upper boundary. However, as Bitcoin entered consolidation within its own range, this coin started to decline and has now returned to the lower boundary.
💫 If the price establishes itself below the range, we will likely see the next leg of the downtrend and a new bearish trend forming.
📊 However, if the lower boundary provides strong support and holds the price above this area, a move toward the upper boundary—and potentially a breakout—could occur.
⚡️ If the lower boundary is broken, the price target would be 0.03472, and further resistance levels at 0.06017 and 0.15361 could be tested.
📅 Daily Timeframe
In the daily timeframe, we can analyze price movements in more detail. As seen, after reaching the upper boundary of the range and getting rejected, the first bearish leg took the price down to 0.02034. Following a consolidation phase and a brief support at this level, the price broke below and completed the next bearish leg down to the lower boundary.
✨ Currently, market volume has significantly decreased, indicating that a major move is approaching. If the lower boundary is broken, the price may continue its next bearish leg downward.
🔼 For a long position, the first confirmation of a trend reversal would come after a breakout above 0.01635, though this is a high-risk trigger. The main confirmation for trend reversal currently stands at 0.02034.
💥 On the other hand, the key resistance remains at the upper boundary of the range. A breakout above this level would confirm a fully bullish trend.
📝 Final Thoughts
This analysis reflects our opinions and is not financial advice.
Share your thoughts in the comments, and don’t forget to share this analysis with your friends! ❤️

ZILUSDT: Trend in daily time frameThe color levels are very accurate levels of support and resistance in different time frames, and we have to wait for their reaction in these areas.
So, Please pay special attention to the very accurate trend, colored levels, and you must know that SETUP is very sensitive.
Be careful
BEST
MT

ZILUSDT 1WZIL ~ 1W Analysis
#ZIL Buy gradually from here if you still have a Conviction on this Coin with a minimum target of 20%++

#ZIL/USDT Ready to launch upwards#ZIL
The price is moving in a descending channel on the 1-hour frame and is adhering to it well and is heading to break it strongly upwards
We have a bounce from the lower limit of the descending channel, this support is at a price of 0.01788
We have a downtrend on the RSI indicator that is about to be broken, which supports the rise
We have a trend to stabilize above the moving average 100
Entry price 0.01855
First target 0.01926
Second target 0.02036
Third target 0.02158

ZIL expecting new lows
The impulsive downtrend hasn't given us 5 complete waves yet, so I'm expecting another bottom below 0.01785 (green III low).
We could be forming an ending diagonal for green V / blue 5 inside the green descending channel.

Zilliqa main support since 2019BINANCE:ZILUSDT
✅Before we start to discuss, I would be glad if you share your opinion on this post's comment section and hit the like button if you enjoyed it.
Thank you.
On chart you can see local D timeframe picture.
Green block main support zone since 2019 so we probably can retest it before bounce in November
Next block is "Local buyers zone" but now its become red and local resistance zone. So after potential drop to main zone we come back and break out this resistance.
To start looking short positions we can at Sellers zone around 0 level by end of November beginning of December.
By indicators
- No signal on D1 timeframe to buy on TradeON indicator
- Big players accumulate position and I think after retest main support zone we will see main signal on "Direction" indicator
Hope you enjoyed the content I created, You can support with your likes and comments this idea so more people can watch!
✅Disclaimer: Please be aware of the risks involved in trading. This idea was made for educational purposes only not for financial Investment Purposes.
* Look at my ideas about interesting altcoins in the related section down below ↓
* For more ideas please hit "Like" and "Follow"!

Zilliqa continuation rally BINANCE:ZILUSDT
✅Before we start to discuss, I would be glad if you share your opinion on this post's comment section and hit the like button if you enjoyed it.
Thank you.
After Metapolis hype we come back to investments zone -0.18 I think we can hold this local buyers zone. If not we 100% bounce from global support zone since 2019.
Now I think this rally can continue to first order block (red one) where we can find out strong sells wall! Like almost all alts ZIL can find out bottom and reversal pattern around October/ November 2022.
For long term everything between 2 and 4 cents good zone for accumulation.
Hope you enjoyed the content I created, You can support with your likes and comments this idea so more people can watch!
✅Disclaimer: Please be aware of the risks involved in trading. This idea was made for educational purposes only not for financial Investment Purposes.
* Look at my ideas about interesting altcoins in the related section down below ↓
* For more ideas please hit "Like" and "Follow"!


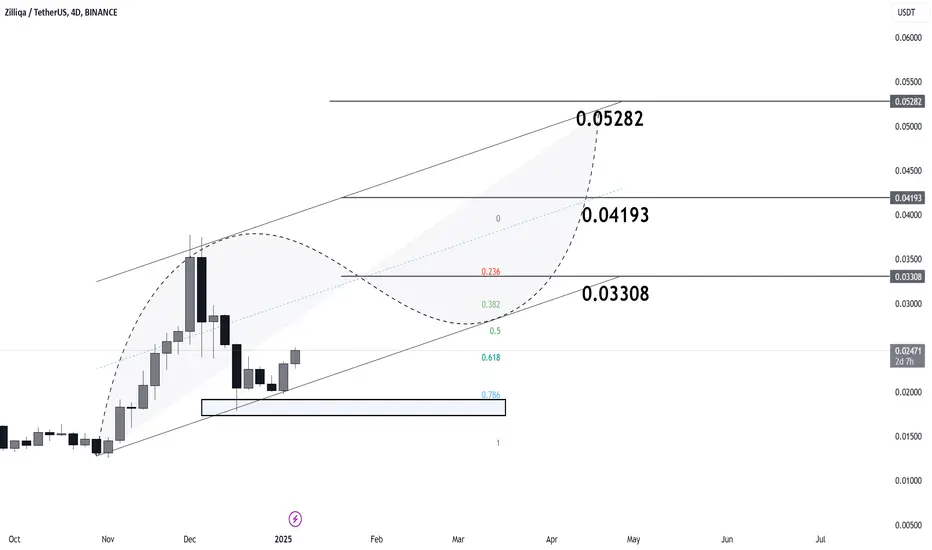
Very bullish market structure on the 4D timeframe 💰 #Zilliqa GETTEX:ZIL
🐃
Rounding Bottom Accumulation → Breakout → V-Shape Recovery forming above the support zone 👀
Retest of the Key Resistance Zone is inevitable - 🎯 $0.03308
Then Price Discovery - Main Target 🎯 $0.05282