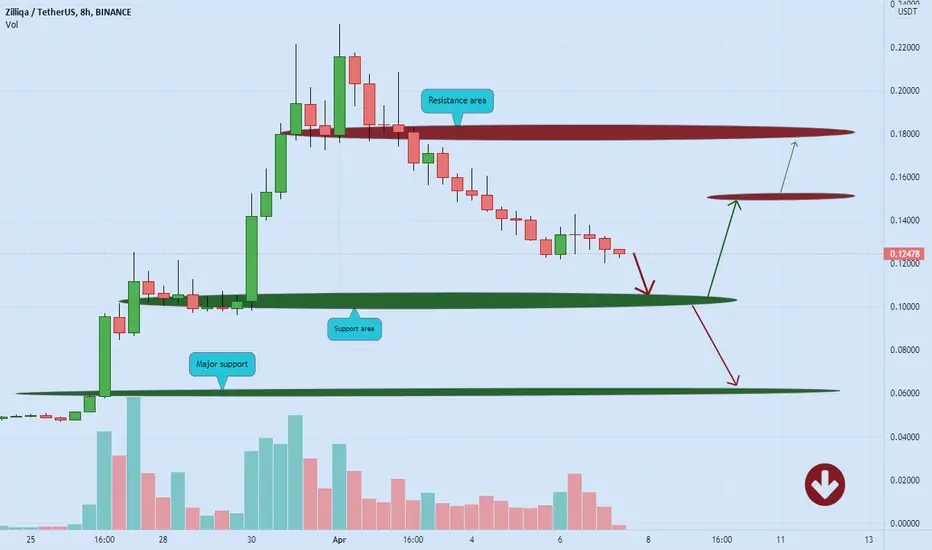
ZILLIQA (ZIL) short position ❌🧨Based on the chart, we can see sharp candles to the upside and again sharp candles to the downside, and we almost lose all Fibonacci levels of support for the price ✔️
and
before more gain, we can see brief correction to the downside, at least to $0.10 ❌🧨
if
we lose our support zone, we can see more correction ❌🧨
and if
the price stays above the support levels, then we can see more gain 🚀
Please, feel free to ask your question, write it in the comments below, and I will answer.🐋
ZILUSDT trade ideas
ZIL/USDT - Momentum Shifts to the upside. ZIL has broken out of the decending triangle and is moving its way back upwards to the local resistance levels mapped out on the chart above. These resistance levels should be flipped to support as ZIL resumes trending up. Next target levels I am watching are listed below:
Local resistance levels I am watching:
0.13750
0.14872
0.15821
0.16684
0.17893
0.18324
0.19316
0.19748
0.20136
0.21172
We need to establish a weekly close above $0.13. The higher the weekly close above $0.13, the better.
Once flipping the last local resistance level and holding 0.22 cents with a close above 0.22, should give us the green light for a new ATH, and for Zilliqa to then enter price discovery where I expect we will reach the $0.30 level.
This is NFA, DYOR and Good luck to All!


$ZILUSD - Wants to break this resistanceHello everyone!
Zilliqa hit this dynamic resistance 3 times already.
Now it has tested an important resistance as support and looks to break the upper border of the downtrend channel.

ZiL Zilliqa still heading down to 10c?It still looks like Zilliqa continues it's March down to 10c maybe even less. Appears to be some support around 9c to 10c range. The 9c range appears to have more possible support than any of the other areas did when ZiL climbed up. However if 9c fails then we may see 5c. We could see upwards movement around 12c again however I'm still bearish. 🤷♂️NFA

This One made a PERFECT Structure!I'm looking around and trying to hunt whatever could make some $ for us, here is what we have for the starting of the day, #zil is one of my favorites as always I tried to hunt it down whether its #long or #short and its always has a reasonable reaction to the points!
Try to have full control of your positions and know how to manage the setups that you are making!


ZILUSDTZILUSDT
Looks good in a falling market
Buy from current prices and 0.12915-0.11044 zone
Target-price 1 - 0.14863
Target-price 2 - 0.15994
Target-price 3 - 0.17264
Target-price 4 - 0.18140
Stoploss - <0.09869

Zilliqa (ZIL) gotta love bullish math.I realize that ZIL may wobble a bit here and there over the next several hours, maybe a day or more. However, from the simple mathematical chart that I've thrown together here, I think we could be in for a good rise if we can just push past that heavy resistance level at about ~T0.1375.
I've assembled this chart to try and be a simple as possible when conveying mathematical charting. There is obviously more that goes into this, however for right now-- this rule of thirds is always something to look for when on an hourly/4hour resolution. More to come on my channel.
I feel that ZIL, ETH and many other tokens are currently VASTLY undervalued. Bottom, basement prices. Like I said...
Patterns, baby.
♠️🤫🐿

Buyer power is strong.There still seems to be room for growth.
The appropriate buying range is 0.13
Be careful to observe the loss limit

ZILSwing Trade Idea using Harmonics Setup for ZIL
Keep an eye on ZIL, forming a shark pattern (bullish) on 1hr timeframe.
0.11142 - 0.11592 safest and best entry point. Take profit at B and C zone!
Take Note: A good entry is equals to a good risk- reward ratio. Therefore, look for the best entry!


Zil analysis in this analysis price broked our trend line and support
we go to buy position with Good R/R and price can go for test Upper fib Levels
Hope to enjoy my analysis

ZILUSDTafter break dawn trend price can tuch 0.158 , breakout with 4hr candle and 1hr will confirm that

ZILUSDT might prepare to reboundZILUSDT is reversing below amid increasing volatility. As cryptos are turning back to a bullish phase, we may see a sharp rebound

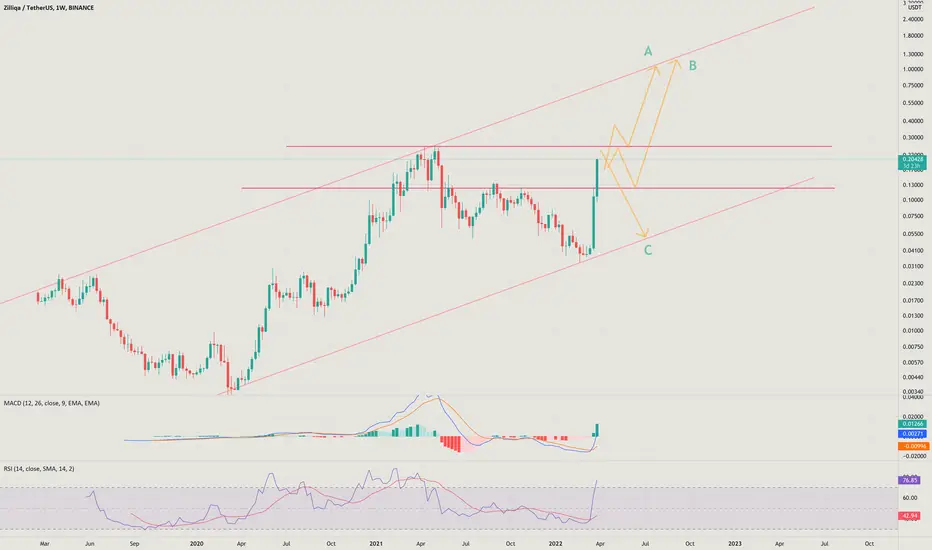
ZIL : (Requested) 3 Options,
Target the main ascending channel trendline
.on daily it needs correction
See price action at resistance..
Zilliqa ZIL Price Targets and Stop LossZIL/USDT short
Entry Range: $0.129 - 0.139
Price Target 1: $0.121
Price Target 2: $0.111
Price Target 3: $0.103
Stop Loss: $0.154
All targets reached


ZILUSDT, buy?Hi, dear traders. This time view is about ZILUSDT. As you can see the chart ZIL has slightly risen and has broken the resistance zone. ZILUSDT is now correcting/testing the support zone. The interest zone lays between 0.9-0.11. Good luck in trades, buddy.

ZIL/USDT time for a buy?Looking at ZIL again and the plan to long from current region should be in effect.
Wait for break and retest of Downtrend with TP set at: $0.16200 , $0.18500, $0.2200,$0.26340.
RSI on the timeframes is heavily oversold and we need to be up above the current 4hr MA to long further.
Thanks for viewing! This is not financial advice

ZIL : A Trade ideaZilliqa (ZIL/H1)
#ZIL is already down by 42% Since the recent pump and is consolidating inside a falling wedge. Will long some #ZIL if the Conditions happen :
1 - Downtrend line gets broken upwards📈
2 - Super trend indicator gives "Buy" Signal in the 1H Chart.📈

ZIL - further confirmationZIL - further confirmation for this small Diamond Bottom pattern,
Pray we heading up soon <3
DIAMOND HAND!

ZIL - is there any diamond within diamond bottom pattern ? xDWhat you think guys ?
i just come across that this diamond bottom pattern that often seen in BTC chart,
what if ZIL forming this ? possible ?
