ZKJ/USDTKey Level Zone: 0.2110 - 0.2135
LMT v2.0 detected.
The setup looks promising—price previously trended upward with rising volume and momentum, then retested this zone cleanly. This presents an excellent reward-to-risk opportunity if momentum continues to align.
Introducing LMT (Levels & Momentum Trading)
- Over the past 3 years, I’ve refined my approach to focus more sharply on the single most important element in any trade: the KEY LEVEL.
- While HMT (High Momentum Trading) served me well—combining trend, momentum, volume, and structure across multiple timeframes—I realized that consistently identifying and respecting these critical price zones is what truly separates good trades from great ones.
- That insight led to the evolution of HMT into LMT – Levels & Momentum Trading.
Why the Change? (From HMT to LMT)
Switching from High Momentum Trading (HMT) to Levels & Momentum Trading (LMT) improves precision, risk control, and confidence by:
- Clearer Entries & Stops: Defined key levels make it easier to plan entries, stop-losses, and position sizing—no more guesswork.
- Better Signal Quality: Momentum is now always checked against a support or resistance zone—if it aligns, it's a stronger setup.
- Improved Reward-to-Risk: All trades are anchored to key levels, making it easier to calculate and manage risk effectively.
- Stronger Confidence: With clear invalidation points beyond key levels, it's easier to trust the plan and stay disciplined—even in tough markets.
Whenever I share a signal, it’s because:
- A high‐probability key level has been identified on a higher timeframe.
- Lower‐timeframe momentum, market structure and volume suggest continuation or reversal is imminent.
- The reward‐to‐risk (based on that key level) meets my criteria for a disciplined entry.
***Please note that conducting a comprehensive analysis on a single timeframe chart can be quite challenging and sometimes confusing. I appreciate your understanding of the effort involved.
Important Note: The Role of Key Levels
- Holding a key level zone: If price respects the key level zone, momentum often carries the trend in the expected direction. That’s when we look to enter, with stop-loss placed just beyond the zone with some buffer.
- Breaking a key level zone: A definitive break signals a potential stop‐out for trend traders. For reversal traders, it’s a cue to consider switching direction—price often retests broken zones as new support or resistance.
My Trading Rules (Unchanged)
Risk Management
- Maximum risk per trade: 2.5%
- Leverage: 5x
Exit Strategy / Profit Taking
- Sell at least 70% on the 3rd wave up (LTF Wave 5).
- Typically sell 50% during a high‐volume spike.
- Move stop‐loss to breakeven once the trade achieves a 1.5:1 R:R.
- Exit at breakeven if momentum fades or divergence appears.
The market is highly dynamic and constantly changing. LMT signals and target profit (TP) levels are based on the current price and movement, but market conditions can shift instantly, so it is crucial to remain adaptable and follow the market's movement.
If you find this signal/analysis meaningful, kindly like and share it.
Thank you for your support~
Sharing this with love!
From HMT to LMT: A Brief Version History
HM Signal :
Date: 17/08/2023
- Early concept identifying high momentum pullbacks within strong uptrends
- Triggered after a prior wave up with rising volume and momentum
- Focused on healthy retracements into support for optimal reward-to-risk setups
HMT v1.0:
Date: 18/10/2024
- Initial release of the High Momentum Trading framework
- Combined multi-timeframe trend, volume, and momentum analysis.
- Focused on identifying strong trending moves high momentum
HMT v2.0:
Date: 17/12/2024
- Major update to the Momentum indicator
- Reduced false signals from inaccurate momentum detection
- New screener with improved accuracy and fewer signals
HMT v3.0:
Date: 23/12/2024
- Added liquidity factor to enhance trend continuation
- Improved potential for momentum-based plays
- Increased winning probability by reducing entries during peaks
HMT v3.1:
Date: 31/12/2024
- Enhanced entry confirmation for improved reward-to-risk ratios
HMT v4.0:
Date: 05/01/2025
- Incorporated buying and selling pressure in lower timeframes to enhance the probability of trending moves while optimizing entry timing and scaling
HMT v4.1:
Date: 06/01/2025
- Enhanced take-profit (TP) target by incorporating market structure analysis
HMT v5 :
Date: 23/01/2025
- Refined wave analysis for trending conditions
- Incorporated lower timeframe (LTF) momentum to strengthen trend reliability
- Re-aligned and re-balanced entry conditions for improved accuracy
HMT v6 :
Date : 15/02/2025
- Integrated strong accumulation activity into in-depth wave analysis
HMT v7 :
Date : 20/03/2025
- Refined wave analysis along with accumulation and market sentiment
HMT v8 :
Date : 16/04/2025
- Fully restructured strategy logic
HMT v8.1 :
Date : 18/04/2025
- Refined Take Profit (TP) logic to be more conservative for improved win consistency
LMT v1.0 :
Date : 06/06/2025
- Rebranded to emphasize key levels + momentum as the core framework
LMT v2.0
Date: 11/06/2025
ZKJUSDT trade ideas

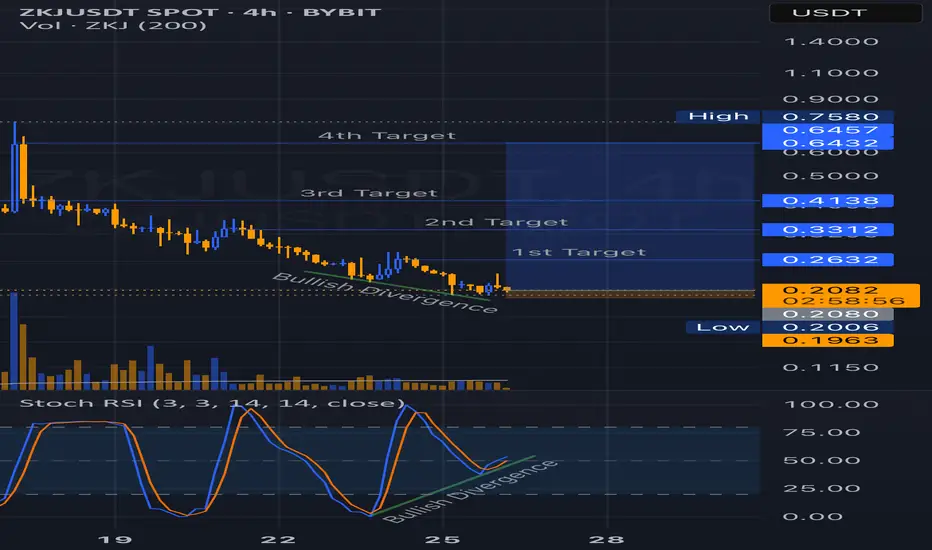
$ZKJ Potential Bottom Detected with Bullish DivergenceI'm observing a potential bottom formation on OKX:ZKJUSDT 4H chart, supported by a clear bullish divergence between price action and the Stochastic RSI.
Price has been making lower lows, while the Stoch RSI is showing higher lows — indicating a possible momentum shift. This divergence suggests that selling pressure may be weakening and a potential reversal could be near.
I've marked 4 target levels based on previous structure and Fibonacci zones:
1st Target: 0.2632
2nd Target: 0.3312
3rd Target: 0.4138
4th Target: 0.6432 - 0.6457
Key support zone lies around 0.1963 - 0.2080.
Invalidation if price breaks below this support range.
Not financial advice. Always do your own research!
ZKJ/USDTBYBIT:ZKJUSDT
"ZKJ 💰 currently has a market cap of $96.59M. The price is at 1.3967 📉, which is a resistance zone 🚧. Resistance levels are areas where the price may struggle to move higher because sellers often step in at these points, causing a potential price reversal or stall.
If the price manages to break above this 1.3967 level 🚀, we could see the next resistance levels at **1.5672** 📈, **1.6839** 💥, and **1.845** ⚡. These are areas where the price might face further selling pressure, which could slow or stop the upward movement.
However, if the price doesn't break through the resistance zone and starts to fall 📉, support levels are crucial. The support levels at **1.300** 💪 and **1.200** 🔽 are points where the price could find buying interest, helping to prevent further declines. Support is like a "floor" where the price tends to stop falling and potentially bounces back up.
It's important to watch how the market reacts around these levels, as a break above resistance or a bounce off support can signal the next move. Remember, price action is unpredictable, and market conditions can change quickly! 🧐
Not financial advice! ⚠️ Stay informed and manage risks wisely."

ZKJ/USDT NEW INCREASE VOLUMEThere are low coins that have a confirmation since the main breakdown trend is on the low time frame of BTC.
ZKJ is in the list of scans to check if it is able to have confirmation coming time frames
This update is just a scan update, which means not that this coin has now confirmation.
