#ZRO/USDT
#ZRO
The price is moving in a descending channel on a 30-minute frame upwards and is expected to continue.
We have a trend to stabilize above the moving average 100 again.
We have a downtrend on the RSI indicator that supports the rise by breaking it upwards.
We have a support area at the lower limit of the channel at a price of
4.70
Entry price 4.84
First target 4.93
Second target 5.05
Third target 5.20
ZROUSDT trade ideas

ZROUSDT 2DZRO ~ 2D
#ZRO Forming a bullish pattern on the 2D Time Frame. If you have Conviction on this coin,. Buy gradually inside this pattern,. With a minimum target of 20%+
ZRO bullish ideaA clean break out of a triangle and Stoch rsi bullish divergence suggest a move upward.

#ZRO/USDT#ZRO
The price is moving in a descending channel on the 4-hour frame upwards and is expected to continue
We have a trend to stabilize above the moving average 100 again
We have a descending trend on the RSI indicator that supports the rise by breaking it upwards
We have a support area at the lower limit of the channel at a price of 3.30
Entry price 3.38
First target 3.57
Second target 3.70
Third target 3.93

#ZRO/USDT Ready to go up#ZRO
The price is moving in a descending channel on the 1-hour frame and sticking to it well
We have a bounce from the lower limit of the descending channel, this support is at 3.42
We have a downtrend, the RSI indicator is about to break, which supports the rise
We have a trend to stabilize above the 100 moving average
Entry price 3.55
First target 3.69
Second target 3.84
Third target 4.03

$ZRO distribution zone 10$I don't like L2, but as an asset for ambushing a bunch of stupid traders-investors the perfect category of crypto assets. We have consolidated above 50 EMA, the market maker will play the profit and put a lot of people into this asset. Do not buy long term, as an option to spill over into short term. Monitor the blockchain and you will be happy!
Horban Brothers.

$ZRO TARGETi use Volume Analysis...
I posted this analysis based on Volume/Volume Profile Analysis, so it will go from this Volume Zone to next volume zone.
it's new type of anaylsis.

ZRO to heroPa is trapped in a symmetrical wedge, the upside would be BO this wedge towards TP: ~$11.

#ZRO/USDT#ZRO
The price is moving in a descending channel on the 1-hour frame and sticking to it well
We have a bounce from the lower limit of the descending channel, this support is at a price of 2.90
We have an upward trend, the RSI indicator is about to break, which supports the rise
We have a trend to stabilize above the moving average 100
Entry price 3.04
First target 3.16
Second target 3.30
Third target 3.50

ZRO, start of a bull run? (1D)Hello, fellow traders!
We see ZRO nearing to its supply zone - the price may reverse now and start a bull run or it might continue the decline further down and reverse there.
In my opinion, it is safe to enter now - but! There are several things to keep in mind.
1. When entering trade, enter with only small portion of your entire balance to manage risks. If you are using leverage, do not overlook the possibility of liquidation.
2. Enter only after you confirm the reversal & start of a trend. Do not make assumptions.
3. Current crypto market will be heavily impacted by the US election that is only few hours away. Depending on the outcome, market may move either direction.
Here's what I'm going to do.
1. Enter now with small amount, small leverage - this is our picket ship. We do not intend to make major profit out of it, its only purpose is to make the minimum profit if the market moves our way with the smallest risk. (I've already done this part)
2. Enter after confirming a reversal.
3. Exit half at 4.2. If we confirm reversal here, we will also exit with the remaining half.
4. If we see a continued uptrend, exit at 5.3, our final target price.
Stay tuned to see the result :)

zero coin to 100$there's high risk in this shit coin be carefull
be patient and don't be greedy
this is my analyse it's not a recomandation to buy or sell !!

ZRO expectation (1D)This 5 months old crypto is currently entering its heavy supply zone!
I would wait for the price to drop down to 2.7238 and confirm the reversal to enter LONG.
Entering now would also be fine since the downtrend was not aggressive, increasing the likelihood of price respecting the zone. If we can confirm the reversal earlier, we might enter then instead of waiting for an additional drop.
But for now, because we do not know where the price will reverse, we will wait to see if price is pulled further back.

LayerZEROCSE:ZRO is a new coin that doesn't have many previous data.
Generally, I expect a decline to the green demand area. Although, I expect it to have a good buying opportunity from there @ $2.65 with a stop-loss at the lowest bottom.
Passing the green lines above is considered cancellation of the idea.
If it breaks the ATL, a re-evaluation will be needed.

ZRO/USDT Breakout Alert ZRO/USDT Breakout Alert 🚀
ZRO/USDT is approaching a crucial resistance zone that could trigger a breakout soon 📈. If the price successfully breaks above this level and holds it during a retest, we might witness a strong bullish rally 🔥.
🔍 Key points to watch:
1. Breakout confirmation: A strong close above resistance is key.
2. Retest: A successful hold at the breakout level turning it into support.
3. Volume increase: A rise in volume during the breakout would signal momentum.
⚠️ Keep an eye on this pair for potential moves, but always remember, this is not financial advice. DYOR (Do Your Own Research) before making decisions. 📊

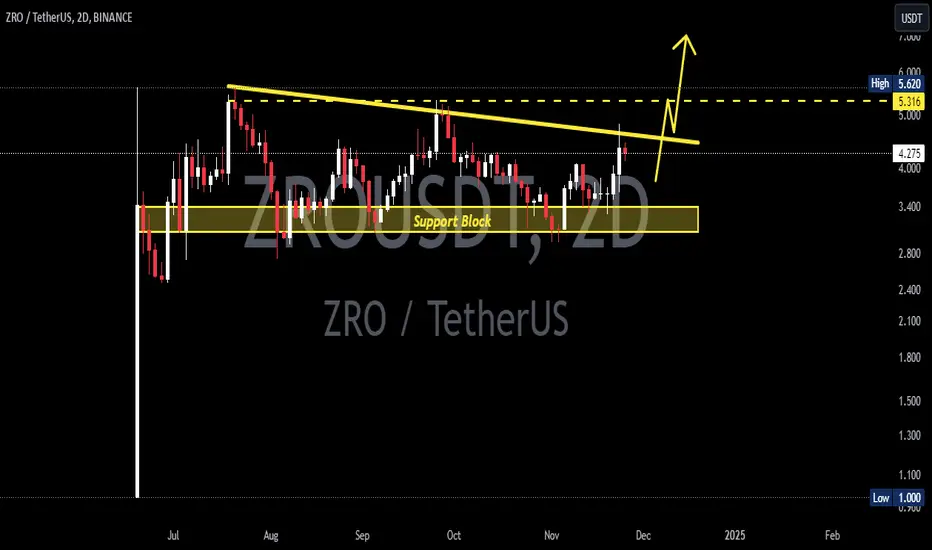
Long ZROUSDT to $5.2ZROUSDT has formed a falling wedge.
Potentially price could reach the target of $5.20
Pending pullback before entry as indicated.

#ZRO/USDT#ZRO
The price is moving in a descending channel on the 4-hour frame
And it is sticking to it well
We have a bounce from the lower limit of the descending channel and we are now touching this support at a price of 3.75
We have a downtrend on the RSI indicator that is about to be broken, which supports the rise
We have a trend to stabilize above the moving average 100
Entry price 4.00
First target 4.15
Second target 4.37
Third target 4.61

ZRO breaks the descending channel?ZRO/USDT is currently in a downtrend, consolidated by the presence of the descending channel. The Stochastic RSI suggests a possible short-term correction, but caution is needed as the MACD still shows selling pressure.
For a reversal, it is important to break the resistance at 4,354 USDT. In the meantime, we should keep an eye on the support levels at 4,004 USDT and 4,108 USDT for potential entry or profit-taking opportunities.
Support: 4,348 / 3,788
Resistance: 4,354 / 4,506

#ZRO/USDT#ZRO
The price is moving in a descending channel on the 1-hour frame and is sticking to it very well and is about to break upwards
We have a bounce from the lower limit of the channel at 4.26
We have a downtrend on the RSI indicator that is about to break, which supports the rise
We have a trend to stabilize above the Moving Average 100
Entry price 4.30
First target 4.68
Second target 4.91
Third target 5.20

#ZRO/USDT#ZRO
The price is moving in a descending channel on the 1-hour frame and is sticking to it greatly and is about to break upwards
We have a bounce from the lower limit of the channel at a price of 4.00
We have a downtrend on the RSI indicator about to break, which supports the rise
We have a trend to stabilize above the moving average 100
Entry price 4.00
First target 4.35
Second target 4.60
Third target 5.00

#ZRO/USDT#ZRO
The price is moving in a descending channel on the hourly frame and we are about to break it
We have a bounce from a major support area in green at 3.00
We have an uptrend RSI that has been broken upwards
We have a trend to stabilize above the 100 moving average which supports the upside
Entry price 3.34
1st target 3.91
2nd target 4.27
3rd target 4.67

Kicking off AltseasonZRO broke out of a symmetrical triangle and is forming a mini base at horizontal resistance. With no unlocks until summer 2025, think this can make a huge run here.
Significant institutional sponsorship

ZROUSDT Poised for a Breakout: Bullish Indicators Signal GrowthThe recent upward movement in ZROUSDT, currently priced at 4.4000, is showing strong bullish momentum supported by several key technical indicators. First, the **Relative Strength Index (RSI)** is hovering around the 65-70 range, which suggests that the asset is nearing overbought territory but still has room to grow before a potential correction. Historically, ZRO has seen continued growth when the RSI moves above 70, indicating potential for further upward movement.
Additionally, the **Moving Average Convergence Divergence (MACD)** line has crossed above the signal line, a classic bullish signal indicating a shift in market sentiment toward buying pressure. The MACD histogram is also expanding, reflecting increasing momentum.
The **50-day Simple Moving Average (SMA)** has crossed above the 200-day SMA in a "Golden Cross" pattern, signaling the potential for a long-term uptrend. This is often viewed as a strong buy signal for traders looking to capture gains during extended rallies.
Volume levels have been increasing consistently, confirming that this rise in price is supported by significant market participation. This uptick in volume suggests that the buying interest is genuine and not the result of low-volume market manipulation.
With these indicators aligning, the likelihood of ZROUSDT breaking above key resistance levels in the near future is high, suggesting continued upward potential for the asset.

#ZRO Technical Analysis in 12-Hour TimeframeHello everyone, I’m Cryptorphic.
I’ve been sharing insightful charts and analysis for the past seven years.
Follow me for:
~ Unbiased analyses on trending altcoins.
~ Identifying altcoins with 10x-50x potential.
~ Futures trade setups.
~ Daily updates on Bitcoin and Ethereum.
~ High time frame (HTF) market bottom and top calls.
~ Short-term market movements.
~ Charts supported by critical fundamentals.
Now, let’s dive into this chart analysis:
After a clear breakout, ZRO achieved a 22% rally but failed to break above the $4.45 resistance.
Currently, the price is holding at the 21 EMA support, but it is likely to reach the support range of $3.68. A good accumulation range for ZRO would be between $3.186 and $3.352.
Key levels:
- Primary Support: $3.68-$3.994.
- Good Accumulation Range: $3.186-$3.352.
- Lower Support: $2.5.
- Target: $5-$6.
DYOR, NFA.
Please hit the like button to support my content and share your thoughts in the comment section. Feel free to request any chart analysis you’d like to see!
Thank you!
#PEACE
