$ZRX, Showing signs of hodling ~2900 sats support...$ZRX
Showing signs of hodling ~2900 sats support (matching EMA50/Ichi Cloud)
UCTS Buy signals on the 1-5D timeframes..
Bouncing from here should lead to a new test of ~3400 sats resistance level (~20%)
Tight SL just in case =)
#ZRX
ZRXBTC trade ideas

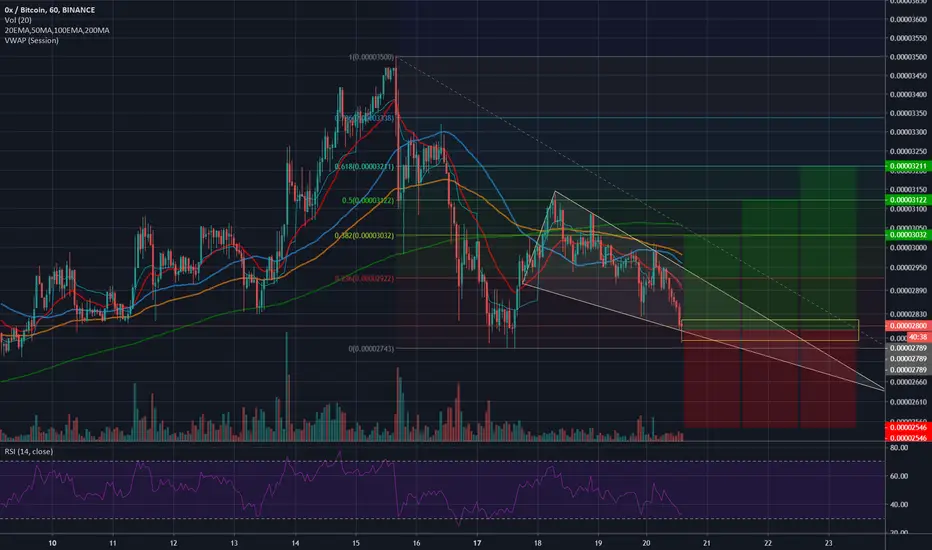
ZRX/BTC 1H (Binance) Falling wedge on support0x Protocol is quite promising for mid-term, let's see if it can grow short-term too.
Exiting this bullish pattern would probably propel it higher but this is a safe set-up:
Entry range= 0.00002815 - 0.00002763
Take Profit= 0.00003032 | 0.00003122 | 0.00003211
Stop Loss= 0.00002546
Risk/Reward ratio= 1:1 | 1:1.53 | 1:2.27
Expected Profit= 8.71% | 11.94 | 15.13%
Possible Loss= -8.71%
Fib. Retracement= 0.382 | 0.5 | 0.618
ZRX
1W From the local low, price has made a strong move into the weekly order block which has been strongly rejected..
On the 1D price came down and found support on purple line, also wicked down into the 25% range which showed buyers present.
200EMA is sweeping in to add to support, price may want to touch this before a move up...
On the 4H price wicked down into the 200EMA and buyers jumped in, if this level holds and acts as support, could be a good long to the 50% ?
Alternately if we go back to the weekly,

ZRX AnalysisZRX 4H chart, rising wedge, bullish adam and eve, may lead to a bullish W formation if the weak regression trend of 0.57 holds. However a breakout would likely lead to greater upsides than the purple box listed, due to the prior structure looking quite bullish for the alt coin. Just a general analysis of pattern structures.

#ZRX/BTC ready to pump.In the short term ZRX seems to be taking off soon.
Jumped right back from the 200D MA which is bullish sign.
Consider these price movements as shakeouts. So do not give up on your alts. They are just getting started,
I entered positions around 2700 to 2980.
Added more to my bag yesterday around 3177 3185 3070.
MACD is bullish. This is a coin you can hold for the mid term.
Alts might have a correction 2 weeks prior to the halving (As per the historical price movements). I will hold till my targets get achieved.
Stay tuned, I'll update the long term and mid term chart soon.
Please support me with your likes and your views if you liked this idea.
#Peace

ZRXBTC Cup & Handle strong Pattern and now 30% up from our entry#ZRXBTC Profit update:
Current price 3401 Satoshi.
#ZRX now 29% up from our entry.
Still more rooms for upward side because Strong Cup & Handle Pattern.
Support:3106/2800 Satoshi
Resistance: 3703/4700/5999/7751 Sat
Resistance = Targets
Please like and follow me for latest Crypto updates and Quality Charts.
Thank you

ZRXBTC ... Time to Fly...As expected in the previous post, ZRX broke the falling wedge and now retesting it at the 0.618 of the breaking move! A good spot to buy with tight stop loss.
I used 5.5% SL. You can use tighter to be save but I'm more optimistic and don't want to ruin this opportunity with a falling wick!
Targets are shown in the chart..
Happy trading :)

0x Conquers MA200, You Know What This Means (220%+ Next)0x (ZRXBTC) conquered MA200 back in mid-October 2019 and is now testing this level as support.
Based on yesterday's candles volume, we could say that MA200 is as good as conquered... If prices for ZRXBTC can remain above this level, 0.00002613, we are likely to see massive bullish action follow.
Here we have a 220%+ target mapped.
This is not financial advice.
Remember to always have a plan/strategy before you decide to trade.
What to do if prices go down instead of up?
When to buy, when to sell?
Set up your strategy, do your own research, find the altcoins that work for you, set your sell orders on target beforehand, collect profits, be grateful and move on.
Thanks a lot for reading.
Namaste.

ZRX/BTC BINANCE 4H CANDLESNice Entry Point here.
If the price breaks out of
the downtrend parallel channel
and enters the uptrend parallel,
new analysis is needed...
low volume so far
BULLISH MACD


0x (ZRX)/BTC on edge of years long Breakout0x/BTC is very much likely to breakout upward from its years long descending channel.
If it breaks. Bullish
it it fails, still more buying oppertunity at it base.
BUY and hold for mind term play.
Bullish!


It's time for 0x to pump the hell out of it!Breaking important resistance level, now, or coming days...

ZRX bullish short term with more potential long termShort term bullish trade on ZRX
enter now at .00002760
Entry: 0.00002760
Stop: 0.00002612
Target: 0.00003150
2.6 R
Notes: Short term, I'm looking for a repeat of the fractal that played out 3 times this month already.
caution, there is bearish divergence on rsi, at least.
I think this is a relatively safe trade, though not as sure as my previous AION idea.
Long term note: This could be the beginning of a much larger bullish move, maybe even surpassing in exponentiality, the rise from September 2019. On daily chart, there is a nice rounding bottom to the correction from that September move, and zooming out, only paints bigger number possibilities.
but for now, lets try to hit a 2.6 R trade.
UIOGD - JMJ
Travis


ZRXBTC Strongly Bullish Cup&Handle Pattern#ZRXBTC Cup&Handle:
#ZRX Brokeout Resistance.
if 3 Days candle Also close above Resistance level then I will Strongly Bullish.
Now current Price is 2900 Satoshi.
if big spike coming Then we can expect 50%-100%.
entry also given in Chart.
Stop loss Must use guys.
Because if BTC Dominance Will increase then alt may go down.
So don't Take risk with your fund.
stop loss is very important .
Keep an eye on every updates.
Please like and follow me for latest crypto updates.
Thank you

ZRX/BTC BINANCE 4H CANDLESZRX/BTC BINANCE 4H CANDLES
Price has breakout the downtrend parallel channel so...
Forecast line come smoothly up to 50%
Huge volume solid green candle
Nice Entry Point here
If price stays in the the uptrend parallel with have bullish move

0x (ZRX) - Signal by EXCAVOZRXBTC After Impulse formed falling wedge and now we break out resistance line.
RSI - growing
I see accumulation zone inside this wedge
Bitcoin dominance goes down and 0x coin with great growth potential and still no pump
Best regards EXCAVO

ZRX/BTC Cup & Handle Pattern Strongly Bullish#ZRXBTC Cup&Handle Pattern:
#ZRX now Strongly bullish and Brokeout Handle Resistance also
Entry: 2619-2800 Sat
Targets: Resistance
SL: 2550 Sat
if any candle close bellow Red trend line then I will Exit.
So I bought at Brokeout Trendline Handle Resistance.
and My Target will be Resistance.
Guys please like and follow me for latest crypto updates .
Thank you


ZRX RETEST & TIME TO RISE #ZRXBTC
Buy at 0.000026XX
Target 0.0000318
SL 0.0000245
Risk: 4% Risk/Reward: 6

$ZRX : Breaking the Falling WedgeNice setup here,
$ZRX breaking up the falling wedge, need some volume
Be careful with $BTC
Not a Financial Advice

ZRXBTC : Double Bottom Formation.ZRXBTC : Double Bottom Formation.
Note: This is only for Educational Purpose this is not Investment advice.
