ZRXBTCZRXBTC update
Entonnoir : W/D/H4 (swing)
Le prix est actuellement en train de compresser en weekly (blanc) et en daily (jaune) juste sous la zone de S/R des ~3500. Le bias est baissier puisque l'on vient du haut de la compression weekly avec en plus une réintégration de celle-ci à la baisse, ce qui est souvent annonciateur d'un biais encore plus prononcé.
Rien à faire avant la prochaine sortie de compression daily qui je pense devrait casser par le bas pour aller rejoindre la zone de S/R des ~2000.
Je rappelle que je ne short pas les alts donc je m'abstiendrai sur cette paire tant que l'on aura pas de biais bullish, ce qui ne devrait pas arriver avant que l'on ait une vraie sortie de compression weekly.
—————
Funnel : W/D/H4 (swing)
The prix is currently compressing on weekly (blanc) and daily (jaune) right under the zone of S/R at ~2000. The bias is bearish because the price is coming from the top of the weekly compression. Moreover, the price has reintegrated this weekly compression which usually means that the bias is even stronger.
Nothing to do on this pair until the next daily compression breakout which should break by the bottom towards the zone of S/R at ~2000.
I do not short alts so I won't trade this pair until we are back on a bullish bias. This won't happen before we have a proper weekly compression breakout.
ZRXBTC trade ideas

oxbtc binance Fujon formed the basic form of a channel that fit exactly the Fujon category.
If he rejects that channel, don't bother him and see Target.
You can enter a range from 1 to 2
With a stop loss of 5%
I gave Target the roof. You can sell it at 2% to 5%.
If it's a bit shed,
I did not buy the area and resubmit

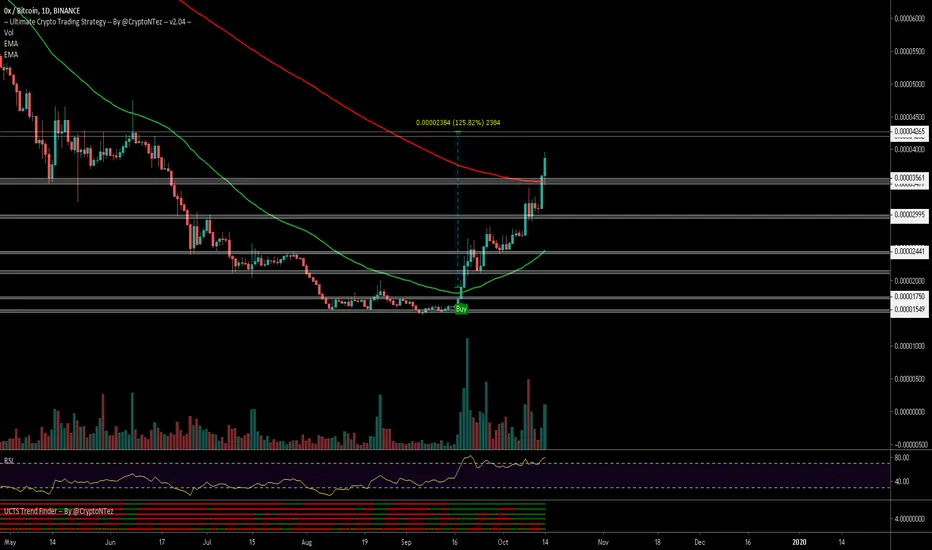
ZRXBTC Golden Cross gives +130% profit potential on BuyPattern: Ascending Channel on 1D.
Signal: Bullish as a Golden Cross has been formed right above the 1D Support which is holding.
Target: 0.00004650 (first 1W Resistance) and 0.00008250 (second 1W Resistance) in extension.


0xPretty bullish setup coming up for 0x, hopefully something more than what we have seen materializes.


$ZRX #ZRX Cup has formed... Looking for handleTitle says it all. Cup has formed, we're just looking for handle to validate the bullish chart pattern.


ZRX/BTC - 44% Potential TradeZRX already 1st touched the daily at 4444 sats , it's going to touch it again.
200MA crossed the 100MA, bullish indicator. Holding the level at 3080 sats . Very good entry at 3100 sats , I suggest you enter there with a target of 4444 sats .
Like I said in my other posts today, this trade may take a little bit, but it will play out. This stuff is clockwork, save this post for later and #PressPlay
As always please do your own research, I am not a financial advisor.
Signal Group: t.me
Group Chat: t.me

$ZRX, Sitting over support at ~3000 sats with decreasing volume$ZRX
Sitting over support at ~3000 sats with decreasing volume after the big drop that happened a few days ago(25%+)...
EMA50 (green) acting as support
UCTS indicator starting to show Buy signals on lower timeframes
On lower TFs picture is clearer aswel..
#ZRX
Managing my stop losses, take profits and trades over 3commas platform for Binance has been a great experience.
I have to do a few clicks and everything is managed automatically by the platform..
Thanks


ZRXBTC is Long-Term BullishZRX is right now in ABC correction. Re-buy ZRX on upper trend line of rising channel ;) Potential profit 120%. I wish you the best re-buy and at least 100% profit heh :) All price values are written in chart :)

ZRX/BTC Bullish price actionHello dear readers,
Today we have bullish price action on 0x.
This altcoin already increased a very nice 180% from the lows, but it looks like it will continue.
There are about 10 bullish altcoins out there right now.
most of them are also still in my previous posts about LINK, DOCK, SEELE, NKN,
The price of zrx broke out of the ichimoko cloud, which signals trend is up. Volume is encouraging as well.
So im carefully entering a small position here.
Buy in: ladder from 0.00003100 untill 0.00003900.
Stoploss: 0.00002800
Target 1 : 0.00004700
Target 2: 0.00005700
Best regards,

ZRX/BTC longZRX/BTC long , possible profit 150 %
ENTRY:
1. 3835 sat. (20% entry)
2. 3545 sat. (20% entry)
3. 3280 sat. (30% entry)
4. 3040 sat. (30% entry)
TARGET:
1. 4594 sat.
2. 5394 sat.
3. 6199 sat.
4. 7800 sat. trailing
GL

ZRXBTC Local Top? | Bearsh Divergence | Parabolic Rise Hello Traders,
Today’s chart will be on ZRX/BTC which may be putting in a local top that is accompanied with a potential bearish divergence. ZRX has risen in a parabolic manner a correction or consolidation is highly probable.
Points to consider,
- Strong bull trend on 4 hr timeframe
- Price tested structural resistance (fake out)
- Local support between .50 and .618 Fibonacci
- Stochastics projected downwards
- RSI respecting downwards resistance
- EMA’s holding price support
- Noticeable increase in volume
- VPVR decreasing in volume of transactions
ZRX has had an impressive run from accumulation zone but now looks very over extended, a consolidation or correction phase is highly probable and we do have some early signs that suggest so.
Price has tested structural resistance; this could be the potential local top due to wicks as sellers are very strong in this area at current given time. Local support is between the .50 and .618 Fibonacci level, this is a good retracement zone if price where to correct from local top.
The stochastics is currently projected downwards, we do have stored momentum in this direction if this bearish divergence where to play out. RSI is currently respecting its downwards resistant line, clearly diverging from price which puts more emphasis on the bearish divergence…
EMA’s is clearly holding price as support, we are still is this parabolic rise until we break the EMA’s decisively as this will negate the market structure.
Volume is currently above average, we do have noticeable increase in bull volume, if price breaks structural resistance, bull volume will then need to sustain to avoid the chances of being a fake out.
The VPVR is quite interesting as it clearly shows a decrease in volume of transactions from current structural resistance and local support. This shows us that price maybe even more probable to retrace to local support due to the lack of resistance being provided by the VPVR.
Overall, IMO, ZRX needs to correct from current levels as this parabolic trend has been over extended, we do have clear signs of a bearish divergence playing out. We may consolidate to cool of indicators or we may correct to local support, putting in a higher low in the trend.
What are your thoughts?
Please leave a like and comment,
And remember,
“Trade the market in front of you, not the one you want!” – Scott Redler

ZRX Thoughts$ZRX
At a crucial level, retesting HTF resistance. Personally, I'd cut my position now and wait for a weekly close above 4119 then re-enter, cuz you know, buy support sell resistance.

Lets play pin the FOMO on the BTC MaximalistThis is a game where we guess when and what price all he recently minted die-hard btc maxamalists start buying ZRX because its going up so fast.


ZRX/BTC - SWING TRADEHi, today we are going to talk about ZRXBTC
We observe a D1 , some important points. The details are highlighted above.
Thank you for reading and leave your comments if you like.
Join the Traders Heaven today, for more exclusive contents!
Link bellow!
Disclaimer: All content of Golden Dragon has only educational and informational purposes, and never should use it as financial advice

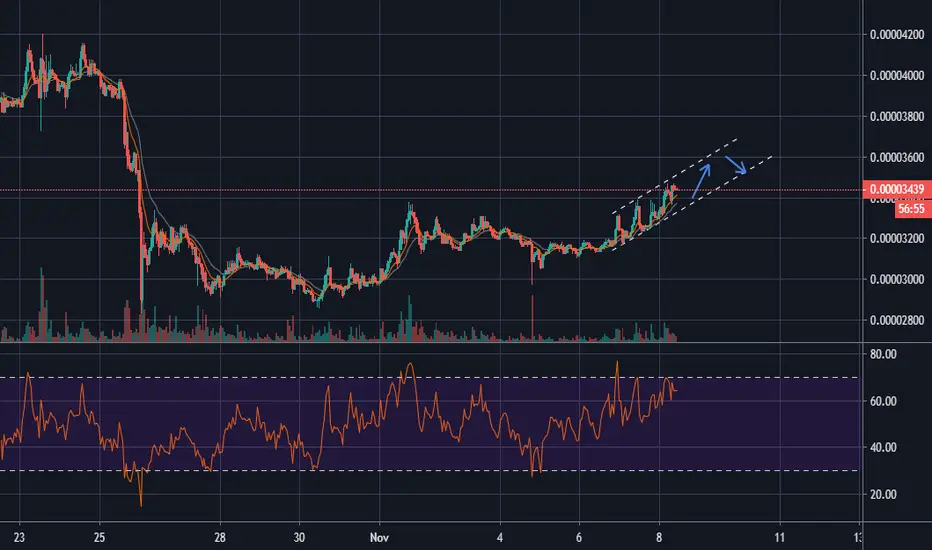
$ZRX, Keeps flipping Resistances into supports on a +100% run $ZRX
Keeps flipping Resistances into supports on a +100% run since Sept 15...
Flipped 3500sats into support over the weekend and now is pushing up again, if you are into this trade, aiming for 4200 sats seems logical
RSI at overbought (bullish)
UCTS Buy signals on the 1D
#ZRX