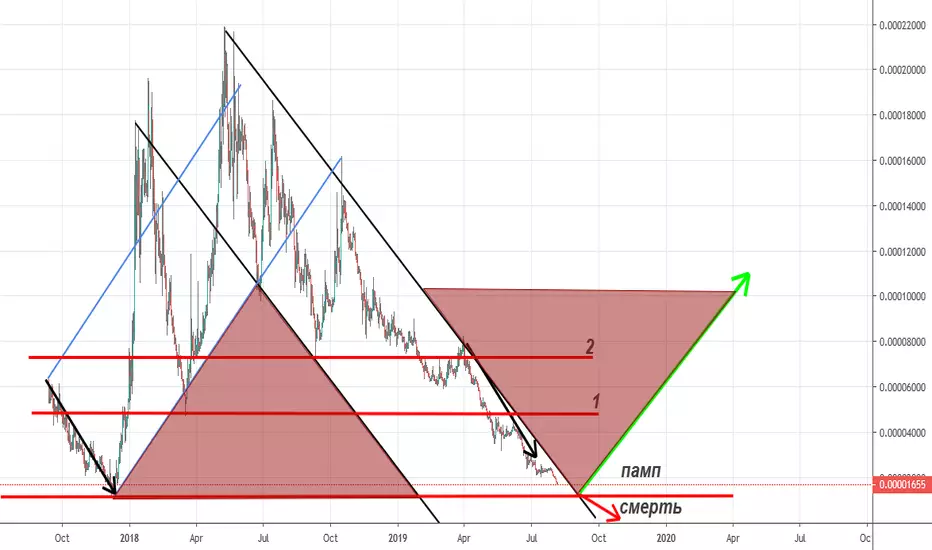
zrx(ox)zrx have important pont =0.0000157
case 1( green way ) :if zrx can break and hold 0.0000157 btc then we can expect that zrx will go to 0.00002035
case 2(red way ) :if zrx cant break powerful 0.0000157 then i think 0.00001157 will be very very good to buy and end of correction .
good luck
ZRXBTC trade ideas


ZRX (0X) 1400% Profit Potential ..!!ZRX (0X)
- Currently at Bottom & Holding the Support in Weekly Chart.
- Forming Bullish Pattern As Well (Falling Wedge) in Weekly..
- Indicators Are Turning Bullish & Buyers Coming in Grab it For MIDTERM/LONGTERM Berfore STORM/FOMO.
- It's One of my Favorite Project
What is 0X ??
0x is an open protocol that facilitates the decentralized exchange of Ethereum-based tokens and assets. Developers can use 0x to build their own custom exchange apps with a wide variety of user-facing applications i.e. 0x OTC, a decentralized application that facilitates trustless over-the-counter trading of Ethereum-based tokens.
Please, give us your opinion in the comments!
If you like the idea, please, hit the Like button and subscribe to the profile in order not to miss our updates.
Join Telegram Channel for more analysis - t.me
The information given is never financial advice. Always do your own research


Weekly Bullish ZRX/BTCThe chart speaks for itself. It is presently at the 2017 low level. If the general market stays consolidated, we may see a pull up from this price level

Strong like 0x So many reasons to go up... Massive Divergence on Weekly chart... 0x is set to explode

ZRX Double Bottom!!Expect 30-40% from ZRX but it is a mid-term analysis!!
Hope Btc stabilizes so that we can see al session soon!!

ZRXBTC moving strong !ZRXBTC :
if the price opens above 0.382 fib resistance line (green arrow) , It Will have a good chance to move to the first horizontal price resistance line (dotted yellow line), then, It will be a matter of time, vol and momentum to reach the main target (bold yellow line)
some ideas
Open at 0.00001765 if stochastic RSI is positive and going up (60% +) and follow the chart
if you see the price goes down then you have a new chance! later

ZRX opportunityThe price did breakout from the channel
and it is doing retest move at this point.
I think aroun 1700 sats. will be nice entry point.
Stop level is under trend line.
I will also post the general view of the chart, check below the page for it.


ZRX just chilling and waiting for its time to comeI will keep an eye on this one. I think it will give us a great opportunities in the future.


ZRX/BTC LONGSignal
ZRX/BTC
BUY
Open 1727;
SL 1669;
TP 1990;
Risk/Reward: 1/4.53
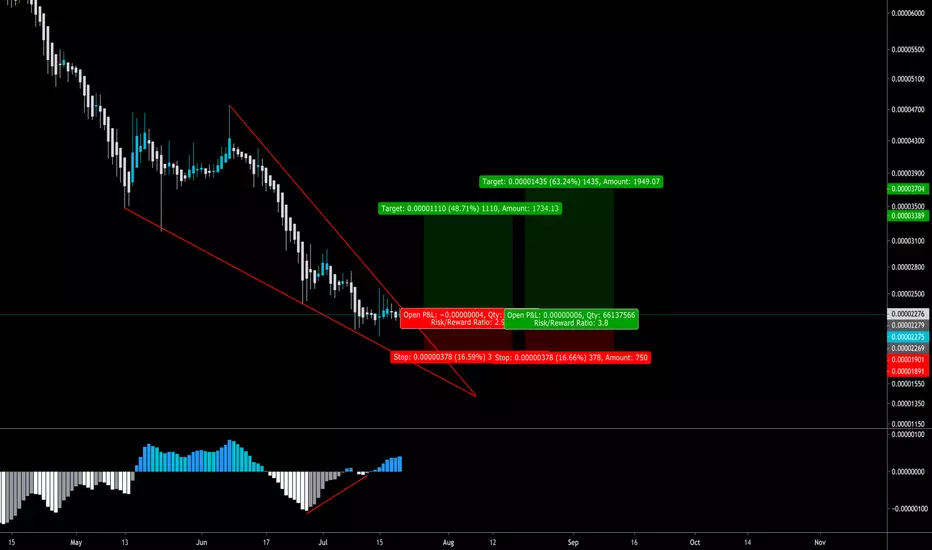
Hey guys! We can see a descending wedge and convergence RSI, AO.

#ZRXBTC 7/19 #ZRXBTC
Buy Between: 0.00002360 - 0.00002124
Target 1: 0.00002596
Target 2: 0.00002832
Target 3: 0.00003304
Target 4: 0.00004248
Target 5: 0.00004720
Stoploss: 0.00002018
Invest: 3%
Risk/Reward: 10% / 111%
we ask Allah reconcile and repay

ZRX - The Optimistic OutlookZRX recently broke bullishly from a pennant, hit resistance around 2400sats and is currently retesting previous resistance (now support) as expected.
Ghost bars represent the ideal path over the coming days if we look to push higher and break out from this triangle-within-triangle pattern (green).
I have a SL set at 2200sats currently, as there is potential for us to fall hard if this pattern breaks down.
A target around the 50MA on the daily (currently ~3620 sats) would be possible, but 2750sats and 3000sats are good areas to take profit.
The risk of us breaking down is relatively high, so take appropriate precautions.

$ZRX falling wedge - long opportunity $ZRX in a falling wedge pattern with bullish div on the 1D
targets are the .5 and the .618 fib extension from the swing high to the swing low
$ZRX, Showing some accumulation under resistance at ~2400sats$ZRX / $BTC
Showing some accumulation under resistance at ~2400sats, If crossed aiming to 3000sats as potential 1st target.
Volume increased over the last days but we need continuation for a movement to the upside..
#ZRX
