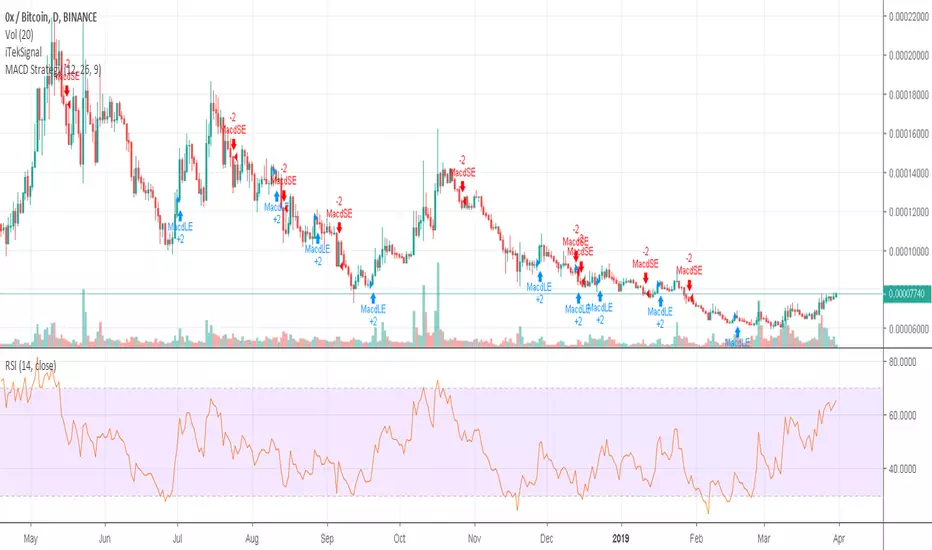
ZRXBTC entered in bullish reversal zoneThe price action is making different harmonic patterns with smooth up-trend and consistent continuity.
This time the priceline is again retraced and failed to break 50MA support to form new harmonic and entered in bullish reversal zone insha Allah.
The targets are:
Buy between: 0.00007087 to 0.00006774
Sell between: 0.00007333 to 0.00008074
ZRXBTC trade ideas

ZRX | LONGZRX retesting the previous resistance line. 3D RSI doing the same. Expecting a strong move up if S/R flips succesfully.

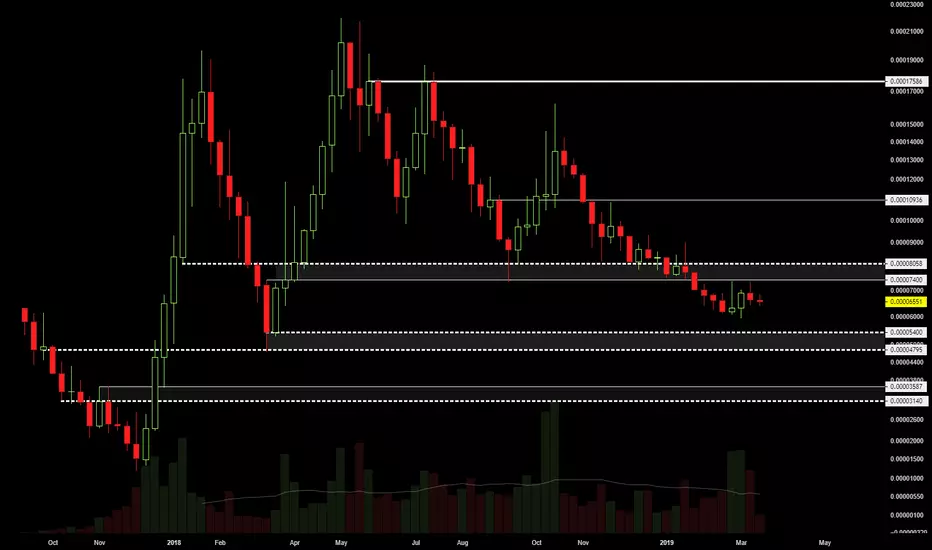
ZRX in Accumulation ZoneThis is a multi-month trading set-up.
- Potential accumulation pattern on chart
- 0x team will supposedly start a discussion around adding / testing more utility cases for ZRX token.
- v3.0 release in ~September 2019

Be a winner buy ZRX nowBroke wedge with Volume. Smashed down at resistance, retracing to mid range. Buy now to see it move up over resistance before anybody else realizes it.

Anchorage above level ZrxCorrection was ready to grow!
Strong project zrx
Creating a tokenized world where all value can flow freely.
0x is important infrastructure for the emerging crypto economy and enables markets to be created that couldn't have existed before. As more assets become tokenized, public blockchains provide the opportunity to establish a new financial stack that is more efficient, transparent, and equitable than any system in the past.

Long All the Cryptos!Lol not all of them, but a lot of alts look very bullish. I Filled up on a bag of $ZRX on Friday.

0x on 1 Day chart looks bullish Hi Folks,
I was away for couple of days and back in trading and TA now.
Hope you enjoy and see my accuracy ~ not all the time but pretty good anyway :-)

0xZRXBTC moving in big falling wedge, also we can see small falling wedges. I see grow potential of this coin

ZRX reloading for next move! ZRX pulling back into support after breaking above guppy is a good sign but we do need to watch out for this pullback as volume has followed this move down.
Continue to see the valid CRUP signal, which is good for bulls!
Target still remains at the 200MA
Thanks guys!

ZRX gained support and getting ready for a new pump #zrx #tatipZRX gained the support and I would be looking to long any retest in this area targeting the 8900 area

Short. There is not enough trading volume to growShort. There is not enough trading volume to grow.
+ CRSI - is the area sufficient summary?
CRSI - in zone that says about downward movement!


ZRXBTC *request analysisZRX perform rising wedge pattern (reversal pattern) and hit resistance trendline.
Maybe it still not a right time to invest at ZRX, coz we have bottom support at 0.00005033
if this pattern break down, bottom reach around mid May.
Even if ZRX success break resistance, maximum projection only 14% at previous resistance at 0.00008833
note : we will update this analysis once we reach 0.00005033


ZRX delivering the goodsZRX is one our crew has been trading a lot over the last 12 months, its been in a strong down trend and to be honest we had lower targets in mind for a strong buy but its started to consolidate and build a new v bottom over the last month which is getting strong, now making higher highs and higher lows, i can see an EW set up building as well, this push which we are in from the bottom we are looking at an exit at the 1.272 extension and a re buy on the retrace and running the last leg up if it can hold support around the 7260 mark.
Volume is increasing really well although sitting above the medium on the CCI i think this will have legs with the current volume.
Have to keep a close eye on BTC though in case we get some big red candles then we might take the risk and move our stops up to lock in profit take and look for a new entry if it falls over.
If this bottom stays strong in a btc down trend then im confident to load back up on demand.

ZRX on the weekly - Downside potential if resistance holdsWeekly support is becoming resistance, gotta do something about it or there's probably even more downside.
Buy boxes are decent IMO, I'll probably buy some ZRX around those.
Updating this if it reaches 'em.

Buy the breakoutWe're on the 50ema if we close above it ride the uptrend gl, We must stay above it though set stop loss just below the 50ema if we break above gl.

ZRX LONG on inverseH&S and longtime resistance breakouta long time BINANCE:ZRXBTC resistance has been broken
and an inverse H&S is at play
I expect a move to high 8400 sats, then re evaluate


$ZRX Trying to break above descending channel/ EMA50....
UCTS buy signal on the 1D
Volume increasing over the last days/weeks
MACD & RSI rising.
Starting to cross over Ichi cloud
Potential targets on the chart.
#ZRX
