ZRXBTC trade ideas

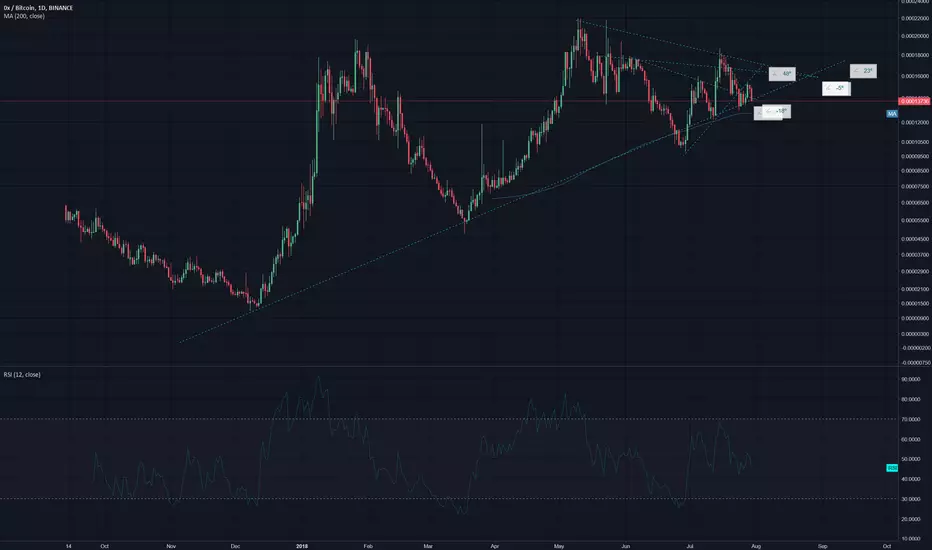
0x (ZRX) - Bullish View Ive been watching 0x (ZRX) with some interest since Coinbase announced this was one of the coins it is considering adding last month. 0x has been performing really well compared to the rest of the market this past month. Currently, it is holding at the 200 day moving average (on the 0x/btc chart). If this triangle formation holds, expect 0x to go to the highlighted area. If the price goes below (c)...then all bets are off.
Please note, this the 0x v. Btc chart (not US$).


ZRX/BTC STRONG BUY
STRONG BUY IN THE GREEN ZONE
retesting long term trendline red
retesting .23 fibo on micro cycle (circled)
retesting 1.00 Fibo on the macro cycle (circled)
GET IT!!!!

zrx/btc H&S on the daily. Not looking goodZRX looks like it might fall hard. Daily cloud about to flip bear, price below cloud, H&S on the daily market generally weak.

massive h&s on zrxwe gonna see and good correction before listing on coinbase so put good buy order around supports


ZRX/BTC STRONG BUY (next buy-in opportunity) STRONG BUY IN THE GREEN ZONE
retesting long term trendline red
retesting .23 fibo on micro cycle (circled)
retesting 1.00 Fibo on the macro cycle (circled)
GET IT!!!!

ZRX/Bitcoin STRONG BUY (Next buy-in opportunity)ZRX is going to restest the long term trendline (red)
and is going to restest the .238 fibo of its micro cylce which lines up perfectly the long-term trendline (red)
And Is going to Restest the 1.00 Fibo of the macro cycle.
STRONG BUY!

0x protocol is forming a YUGE Ascending Triangle here.Last year when I bought ETH at $350, no one believed that it was going to $700 or even $1,000.
My thesis here is whenever there's network effect working, the value of an asset is going to increase, exponentially!!
**This is NOT investment advice, trade with your own responsibility.

ZRX (0x) Long OpportunityZRX is currently touching an upward trendline that started back in January. This is an opportunity to go long with a close stop loss. If this line breaks, except a rather huge drop, but given the history I would say it's likely to hold.

$ZRX, Red Days Ahead…
Weekly
Looking at our trend timeframe we see price has formed a double top: top 1 at 20000 and top 2 at 18000. Stochastic RSI showing momentum is heading towards the downside with no signs of slowing down. ZRX is currently testing our psychological support level, possible reversal at this level. Overall I’m expect a drop towards our dynamic/horizontal support level at 11000. A daily close above 15000 activates our trade.

0x VS Bitcoin Buying Opportunity0x trend remains upwards as the price continues to produce higher highs and higher lows. Currently ZRX/BTC is in a correctional phase, while the price has declined from 18600 satoshis high, down to the 13000 satoshis, losing 30% to Bitcoin.
At 13k satoshis, ZRX has rejected the 88.6% Fibonacci retracement level applied to the last wave up. At the same time it has rejected 61.8% Fibs applied at the beginning of an uptrend. Both of the Fib levels were rejected along with the 200 Moving Average.
If 13k support area will hold, the uptrend is likely to continue, but consolidation could take place prior to that.
Nevertheless, if the daily close will be below 12900 satoshis low, further correction should be expected. Price could drop towards 12k or 11k satoshis area. And only break and close below 10800 satoshis would invalidate bullish outlook and downtrend continuation can be expected.

ZRX/BTC 4 hr..Highly Volatile...Hello everyone, to a requested look at ZRX (0x) spread to BTC. Thank @Aromur for being the first to PM my open-offer TA ;-)
I have not looked at this asset nor traded it. So hopefully my analysis will be insightful and somewhat objective. I am not in this trade--hence the neutral position. However, if I like what I see, I will not hesitate to long ( I will explain).
Liquidity with this asset is roughly 57%, with the bulk of trading on Binance. My dominant TA here is that we are in a 1,2/1,2, so long term implying much higher prices. However, take note of the volume spike and the break. This implies, at least in a shorter time period, lower targets, and thus, a much better R/R there. Huge overhead resistance will almost certainly slam any attempts to run this to an impulsive 3rd target, which is so high it will not be visible unless you scroll way up. Lower targets for sellers are yet unrealized. I have set some alarms and will update this asset, as I will be no longer be posting any of my personal trades (due to security reasons).
Stay tuned for updates.

0x ZRX 4 Hr Market UpdateWe have a symmetrical triangle forming
Wont be able to confirm until we have a clear BO or BD
Things to watch out for:
Test of the .786 Fib
Support and Resistance areas
Still below the Ichimoku

Orders setLooks like ZRX is close to filling a gap with a nice bounce opportunity. I'll have some ready just in case!
Good Luck!

ZRX / BTC - BINANCEkeeping eye on it for breakout of the channel/bull flag. 20 EMA ready to cross 50 MA. When these two things happen, measured move and volume should come.


ZRX/USDHello traders,
Looks like ZRX altcoin season is in! look at that expanded 5
Beatiful chart with an leading diag

$ZRX Ox to coinbase
Currently waiting for a little more retracement before thinking about entering, additionally eyeing a potential H&S.
