ZRXBTC trade ideas


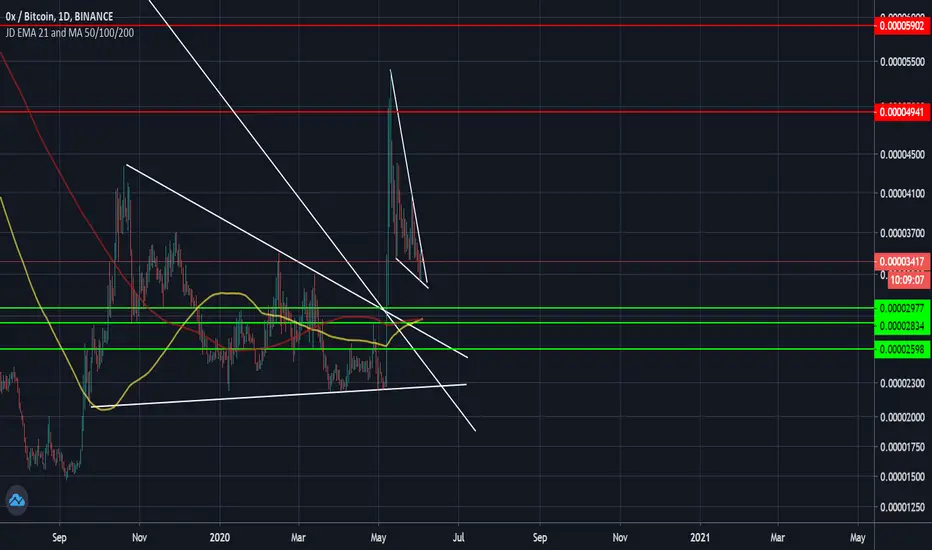
0x (ZRX) Moves Above Support, Chart Analysis0x (ZRXBTC) can easily bounce now that EMA50 has been tested and prices moved above EMA10 on increasing volume.
This "bounce" (green arrow) is only possible while prices remain above "support".
If ZRXBTC moves below EMA50, lower support can be tested.
Even if prices drop, we remain bullish long-term (red arrow).
Thanks a lot for reading.
Namaste.
-----
This is not financial advice.

ZRX Is that all you got?Looking for more.
Could be a bullish rising wedge if it breaks above the horizontal line.


4 Hr. Practice Trading (Using MACD) W/+50/200 EMA (PART 1)Curious to see if a new configuration will lead to better lower timeframe (4hr) results. No targets for now, however moving up stop loss once break out begins. More or less just recording data and seeing if I can catch MACD breakouts.
Im used to working with daily and weekly FYI
ARU
"STOP LOSSES PEOPLE!!!"


ZRXBTC attempts to have a breakout 🦐ZRXBTC attempts to have a breakout According to Plancton strategy, we can set a nice order
–––––
Follow the Shrimp 🦐
Here is the Plancton0618 technical analysis, please comment below if you have any question.
The ENTRY in the market will be taken only if the condition of Plancton0618 strategy will trigger.


$ZRX - at descending trendline resistance. - breakout would give 10-15 % jump from here
- buy at retest of trendline

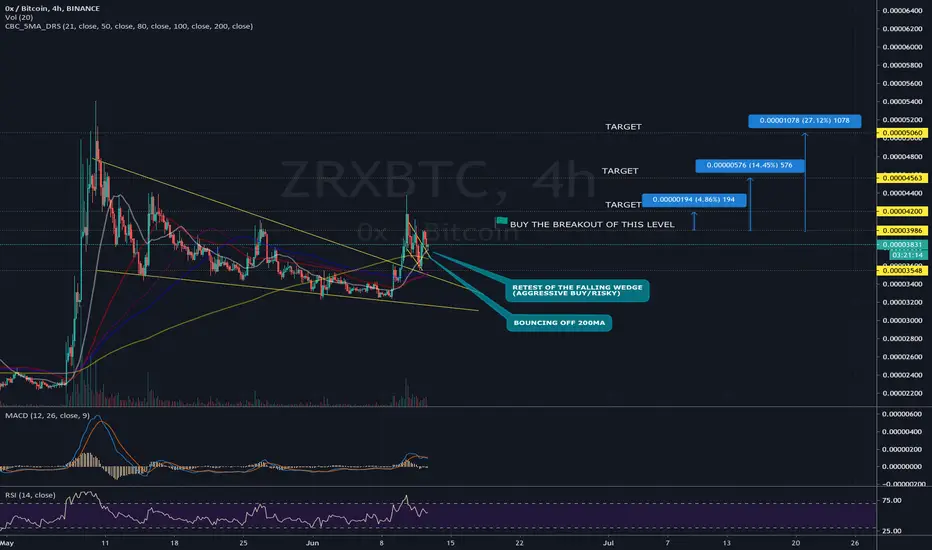
ZRXBTCThe price is now going into a corrective wedge,
Entry buy is after breaking the wedge and retesting
The goals are shown in the chart
Good luck.

ZRX - POSSIBLE CONTINUATION OF THE RALLYZRX seems willing to continue the rally after breakout and retest of the triangle.
On the chart my target and stop loss.
There are two possible trades here.
TP 1 RR 4x (40% vs 10%)
TP 2 RR 6X (110% vs 17%)
I opted for a mix of the two: once first target is reached, I will close half of the position and move SL at break even, then I will let profit go until some new catalyst comes out.
Disclaimer
This is not a coin that I am going to keep in my ptf for a long time. Just a short term speculative trade.

ZRX - possible long entry off retracementAlts used to take quite a quite to correct but we are seeing things speed up this time around. Is bull season among us?

Be on top on Techno And Understand Crypto!As simple as it is, learn around market what is the current technologie, then anticipe the wanted informative results from consumer and user.
If you can see further than your nose with actual demand and resources in stock generally speaking, you can imagine where those resources or stocks level will be. Then with the idea on who or what brand will emerge or have the contract, bid on that perspective.

ZRX / BTC Bullish Trade IdeaDeFi projects are likely tohave some pumps these days with some news backed up.

ZRX possible head and shoulderslooks like head and shoulders is forming
macd looks to be heading back to the upside
hopefully bitcoin plays ball as its been ruining possible ideas


ZRX closing on 200 Hull while volatility is fading►ZRX was one of the top-performing assets making 135% from its May low to its High
►It has been in a correction since
►Volatility is fading giving space to another possible big move
►Hull Moving Average closes on High Volume Node's beginning, I think it might give the price a little stop over there
►I will buy slightly above that level with stop-loss about 0,75 ATR below.
Good luck. What is YOUR viewpoint?

ZRX/BTC downtrend broken, bull pennant, possible support retestAs we can, ZRX has broken both its short-term and long-term resistance and is currently forming a bull pennant. I am expecting it to make a decent move up and test its current high but it is likely, it won't break and the reason for my thinking there is that it has not retested the symmetrical triangle it broke up from for support which has additional confluence with both 100 & 200 DMA coinciding with it. Although, it is possible that it breaks up from the current pennant and keeps making higher highs, starting a new uptrend, I would rather be cautious..So, if I were in it, I would sell its test towards its current top and take profit there AND THEN see if it breaks its current high or not and based on that make my decision to either re-enter upon breaking current high or WAIT and buy lower when it retests the triangle & the 2 strong MAs for support.
I AM NOT A FINANCIAL ADVISER, DO YOUR OWN RESEARCH!