0x Short Term Symmetrical Triangle Breakout PatternBreakout pattern sees 0x reaching major resistance at 1.30 after breaking out of symmetrical triangle pattern. Possible retest of lower levels before continuation.
ZRXUSDT trade ideas

ZRX - h4 bullish correction and we goAnother exclusive opportunity, time to burst.
First target is ATH. Will revise then, but I expect a strong rally onto the 2022

zrxusdtam adding 2k on this one , i think it has a good chance to break to the upside, with a tight stop loss, just to be safe, this is not an advise

ZRXUSDT MAP!Zrx is one of the coins that's hasn't broken out yet.
ZRX play been so far: Buy when RSI is the oversold area below 37% on the three-day chart.
Take profit on 1.618 Fibonacci and reload again when rsi below 37%. The past two run-ups have been a perfect hit!! Will it repeat?
Key: Hold 0.78$ on the 3D chart.
Ideally Entry zone:
1) 0.82 - 0.88
2) buy after breakout and retest the pink trend line.
ZRX bitcoin pair is @ 4-year extended Support with RSI at oversold zone. The past three times zrx/btc bounced off very nicely. #good risk/Rewards
won't mind giving it a shot. As long support hold Tp on the chart
you can never go wrong buying something at strong support.
Previous ZRX update

ZRX head and shoulders#ZRXUSDT
$ZRX shaped inverted head and shoulders pattern in weekly and daily time frames.
the daily H&S is inside the right shoulder of weekly one.
target of daily H&S is around $1.45 (45%)
target of weekly H&S is around $1.86 (87%)

ZRXUSDT keep an eye on this scriptIN coming days it can give good breakout from current level .stoploss would be very small and target is very big.

ZRXUSDT LongZRX is in a short-term uptrend and is currently breaking through a long-term downtrend. Hopefully I've made it clear enough in the analysis. :))

ZRXUSDT AnalysisHello friends.
Please support my work by clicking the LIKE button(If you liked).Thank you!
Everything on the chart.
open pos: market
target: 1.5 - 1.6 - 1.8
after first target reached move ur stop to breakeven
stop: ~0.97 (depending of ur risk). ALWAYS follow ur RM .
risk/reward 1 to 3
Good luck everyone!
Follow me on TRADINGView, if you don't want to miss my next analysis or signals.
It's not financial advice.
Dont Forget, always make your own research before to trade my ideas!
Open to your questions or suggestions(Looking for investors!).

zrx usdtIntroducing zrx currency ... zrx currency has a strong mental fund and buying this currency is very valuable for keeping it in the medium and long term at a price of $ 1.The first target is $ 3.7 in the medium term

ZRXUsdt Rdy for PUMPthis coin have good chanse for big pump on ALTSeason and now after BTC little save position and hold position altcoin start moving
GL
EntryPoint:
1.0011
0.9572
Supports:
0.9258
0.8302
0.7442
0.6373
Resistance:
1.0593
Targets:
1.1715
1.4334
1.9107
2.7554
for HODL:
4.3867
5.5940
7.9274
GL

#ZRX , Time 1WBuy after retest of Trendline 1 or after breakout of "1W" candlestick outside the Trendline.
Sell after retest of Trendline 2 or after breakout of "1W" candlestick outside the Trendline.

ZRX - BREAK OUT AND RETEST AND PUMP!Candles are giving us that expectation. If the price closes above the downtrend. We can expect this to be the real breakout!
This is the downtrend line since April. 10 months and five bounces.
After breaking will be a real strong uptrend. I wait for that.
We wait for the confirmation closing candle of tomorrow to enter the order.
Target: Moon!
ZRX/USDT SHORTLook like a good short on 4h time frame, take profit under the big yellow line
stop loss - 1.0370
Good luck.
NFA and DYOR

ZRX UsdtZrx broke sma 200 and it can goes down. It time to short it. Buying zone started from .91
. I am going to buy at that area and I will never take long entry on this crypto.

ZRX/USDT
Buy with limit if price reached 1.05$ or 1.10$
Buy-Setup:
1️⃣ Point: 1.10$
Selling Targets:
1️⃣ Target: 1.32$ = 20% Profit
🔻Daily Close below : 0.92$ = 20% Lose
#Risk/Reward: 1/1
Link: 👉 #ZRX/USDT
🏦Ex: Binance/Spot
🧩Capital 5% or 10%
📊#Technical_Analysis_by_Phoenix


To the moon. IMOBroke the resistance with great volume and retesting done. destined to the MOON.
Take profits.. 1.16, 1.27, 1.45, 1.63, to the moon
stop loss: 0.95

ZRXUSDT Daily TimeframeSNIPER STRATEGY (new version)
It works ALMOST ON ANY CHART.
It produces Weak, Medium and Strong signals based on consisting elements.
NOT ALL TARGETS CAN BE ACHIEVED, let's make that clear.
TARGETS OR ENTRY PRICES ARE STRONG SUPPORT AND RESISTANCE LEVELS SO THEY CAN ACT LIKE PIVOT POINTS AND REVERSE THE WAVE (or act like a mirror that can reflects light) BASED ON STRENGTH OF THAT LEVEL.
ENTRY PRICE BLACK COLOR
MOST PROBABLE SCENARIOS TARGETS GREEN COLOR
LEAST PROBABLE SCENARIOS TARGETS RED COLOR
DO NOT USE THIS STROTEGY FOR LEVERAGED TRADING.
It will not give you the whole wave like any other strategy out there but it will give you a huge part of the wave.
The BEST TIMEFRAMES for this strategy are Daily, Weekly and Monthly however it can work on any timeframe.
Consider those points and you will have a huge advantage in the market.
There is a lot more about this strategy.
It can predict possible target and also give you almost exact buy or sell time on the spot.
I am developing it even more so stay tuned and start to follow me for more signals and forecasts.
START BELIEVING AND GOOD LUCK
HADIMOZAYAN

The opportunity in ZRXThe opportunity in ZRX
The entry point is 1.12 -1.15$
First target 0.6$
second target 2.1$
third target 2.3$
Forth target 2.9$
Fifth target 0.39$


ZRX about to break trend lineZRX (0x) is about to break trendline, opportunity to trade with good risk reward.
Best entry points on trendline breakout/retest

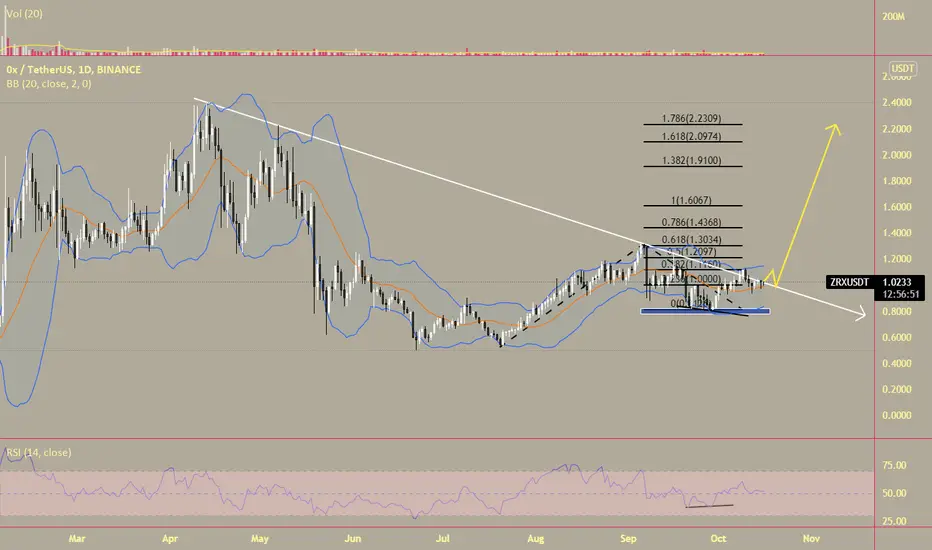
🆓0x (ZRX) Oct-6 #ZRX $ZRXZRX has good support at 1$ zone and is heading to 1.2$, 1.6$ and 2$ zones in this October. But if it loses this zone, it will fall down to 0.85$ zone
📈RED PLAN
♻️Condition : If 1-Day closes ABOVE 1$ zone
🔴Buy : 1
🔴Sell : 1.2 - 1.6 - 2
📉BLUE PLAN
♻️Condition : If 1-Day closes BELOW 1$ zone
🔵Sell : 1
🔵Sell : 0.85
❓Details
🚫Stoploss for Long : 10%
🚫Stoploss for Short : 5%
📈Red Arrow : Main Direction as RED PLAN
📉Blue Arrow : Back-Up Direction as BLUE PLAN
🟩Green zone : Support zone as BUY section
🟥Red zone : Resistance zone as SELL section
🅰️A : The Close price of 1-day candlestick is Above the zone
🅱️B : The Close price of 1-day candlestick is Below the zone

0x ZRXUSDT - HUGE Rising wedge- ZRX is very bullish on the weekly macro scale.
- We have a rising wedge , that greatly holds support.
- Bullish volume is higher and RSI is prepared for a pump!
- Profit target 1:1 fib extension or top of the wedge
- Check my related idea about 0X vs BTC below!
- For expected duration of the trade, probability, stop loss, profit target, entry price and risk to reward ratio ( RRR ) - please check my signature below ↓
- If you want to see more of these ideas, hit "Like" & "Follow"!
