ZRX100 trades crypto series
Starting date: 9/August/2021
Day 5
Starting capital: $500
Capital at present: $700
(all trading ideas in the series with commentary and outcome can be found on my profile)
BULL view:
-Moving back to fair value zone
-Break of the bear resistance
-Strong bull BO
-Broke above higher low
Bear view:
Short term bear trend can still be in tact with a deeper correction
ZRXUSDT trade ideas


ZRX100 trades crypto series
Starting date: 9/August/2021
Day 4
Starting capital: $500
Capital at present: $583
Trade nr. 16
(all trading ideas in the series with commentary and outcome can be found on my profile)
BULLISH VIEW:
-Broken above multiple resistances (local downtrend, local resistance of fair value - pink channel)
-Quite strong rally
-Broke above LH of the prevailing trend - HH trend reversal.
BEARISH VIEW:
-Still a possibility of a bear flag.
Initial target - control price as well as local tops.
Second target, top of the channel of fair value.

🚀 ZRX LONG PUMP IS POSSIBLE very soonMy personal analysis is that the ZRX could soon break the resistance and reach the 1.7 range.


ZRXUsdt have great chanse for PUMPzrx SO GOOD AND HAVE GREAT CHANSE FOR PUMP
i think going moon but little wait and cant say this now
you buy this on suppor tline adn rdy for good profit easy profit
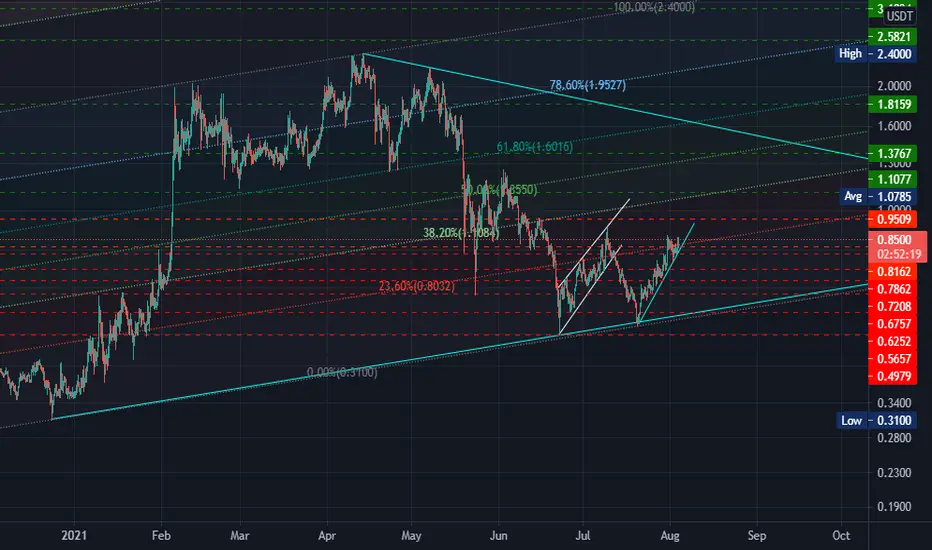
ZRX Break first Resisdance now that is Enter point :)
Support:
0.8162 This enter point . this is first resisdance but now is
0.7862 Enter Point
0.7208 Enter Point
0.6757
0.6252
Resisdance:
0.8162 Break this now
0.9509
Taregts :
1.1077
1.3767
1.8159
FOR HODL
2.5821
3.1024
4.0395
GL guys
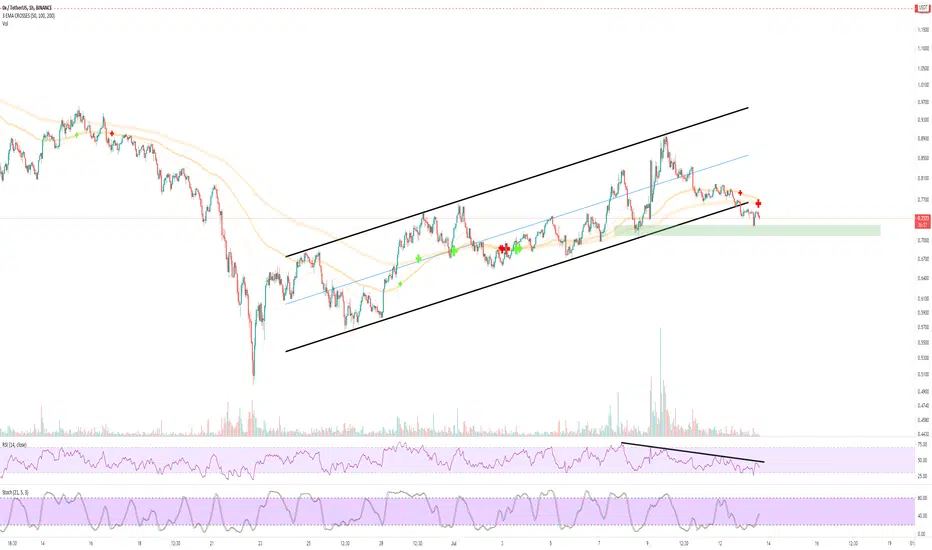
Zrx shortZrx formed a rising wedge a short signal, also fro. The 4hr tf a lot of.imbalance to be filled.

ZRXUSDT LONGZRXUSDT LONG
Remember risk management 2-3% max
Adjust SL 0.5-1% below entry once around 3-5% in profit


zrxusdlol massive accumulation during this crash, looks like whales are loading up on alot of coins right now. cmf divergence as well, we shall soon see top coins 100% gains again

ZRXUSDT - INTRADAY LONG SETUPHere on ZRX daily timeframe everything is bearish the market has formed this impulse to the downside breaking below the previous high, what we can also see on the daily is the market has printed this M formation. After an M formation we expect the market to complete the pattern at the neckline giving us our intraday upside target. However if you drop to lower timeframes you can see everything is still currently bearish on lower timeframes and no signs YET of the corrective move to the upside. We will be waiting on the lower timeframes to see if the environment of the market will cut back bullish, if all our entry rules are satisfied this is when we will take a nice long position.

ZRXUSDT on Horizontal SupportHolding strong on Horizontal Support
Entry if it breaks Downtrend Line
SL under Support

Get Ready For Second Big Bullish Wave Of Ox (ZRX)SMA and key level support:
After a powerful bull run the price of ZRX dropped at a very strong support of $0.50 which is a key level of support for the priceline of ZRX. Previously this $0.50 support level has been working as a resistance as well. Now the same time the price action of Ox has also bounced by the weekly 100 simple moving average support as well. Therefore, at the same time, the ZRX is having a strong support of 100 simple moving average and the key support of $0.50
Stochastic and MACD:
After this drastic drop it can be easily observed that on the weekly time frame chart, the stochastic oscillator has entered the oversold zone, which is indicating that the ZRX is quite oversold now. If we take a look at the moving average convergence divergence (MACD) indicator then it can be also noticed, that it has started turning bullish, previously it was very strong bearish.
Falling wedge and RSI:
On the daily time frame chart, the priceline of Ox was moving in a falling wedge pattern. This is considered to be a bullish reversal pattern and if we watch the movement of the candlesticks within this falling wedge with the combination of RSI oscillator, then it can be observed that whenever the price line is reaching the support of falling wedge and RSI is visiting the oversold zone, the candlesticks are moving towards the upside and making attempts for the breakout.
Finally, the price action reached the support while the RSI was entered the oversold zone. The price action of ZRX started moving towards the upside with the RSI and broke out the resistance of the falling wedge pattern. At the moment it is trying to break out the 50 simple moving average on the daily time frame.
Big bullish Butterfly move:
On the 4-day chart, the price action of the ZRX has completed the bullish Butterfly pattern. There is also 100 simple moving average support in the buying zone and the 200 SMA below this zone. The buying and sell targets as per the Fibonacci sequence of the Butterfly pattern should be:
Buy between: $0.95 to $0.5555
Sell between: $1.26 to $2.00
The maximum extent of potential reversal zone to $0.5555 can be used as stop loss or to minimize the risk factor the 100 SMA can be used for this purpose. As per the above targets, this trade has a huge profit possibility of 260%, and the high loss possibility upto 42% but I would suggest using 100 SMA as stop loss to minimize the loss.

ZRXUSDT LONG SETUP
ZRXUSDT is looking bullish, on the daily and 4hr timeframe we can clearly see a new uptrend forming. On the daily the price has provided us with a correction to test the 0.50 fib now i am expecting to see the continuation to the upside, we will be waiting on the 4hr timeframe for a new higher high and entry rules to be satisfied BEFORE we can long this pair.

The important line is lostWe have a pattern of three ceilings ...
An important line is missing ...
Ready to fall
sl: 0.7663
tp: 0.6594
tp2: 0.5928


0x ready for moon!!Hello everyone.
everything is clear, with this risk/reward ratio ZRX is very promising.
Just wait for the monthly candle to be closed.
