ZRXUSDT trade ideas


ZRXUSDT (0x / Tether) Dailyhi
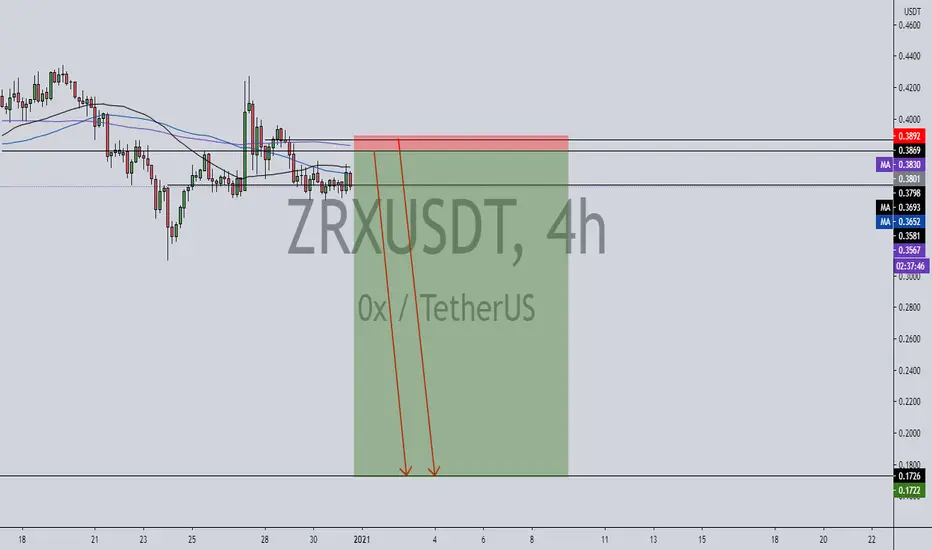
here we have two specified TPs based on FibRetracment and FibTimebase and Fib Projections so we can see many Fibonacci confluences ate TP zones and can be very optimistic about this pair
probably we should be achieving the TPs in the TP zone box
it is a little big swing trade
please comment you opinions
thanks

ZRX-USDT Greetings,
price is moving in an uptrend channel, with a potential of about 300% per channel width at the breakout.
ZRX -USDT price is stuck in a channel about 20% wide, between 0.32-0.43.
An entry point may be at the border of this channel or at anchoring above the 0.43 area. Coin may be said to be old from the year 17, but it is on the deficit list. Also see my other ideas for defi projects.
Always use a stop loss, and don't use a leverage greater than x3.
A trader should always have tomorrow.
If you found the information useful, please like and subscribe, so as not to miss anything.


ZRXUSDT is trying to have a breakout 🦐If $ZRX.X will have a breakout from daily resistance and ascending channel, According to Plancton's strategy (check our Academy), we can set a nice order
–––––
Follow the Shrimp 🦐
Keep in mind.
🟣 Purple structure -> Monthly structure.
🔴 Red structure -> Weekly structure.
🔵 Blue structure -> Daily structure.
🟡 Yellow structure -> 4h structure.
⚫️ Black structure -> <4h structure.
Here is the Plancton0618 technical analysis, please comment below if you have any question.
The ENTRY in the market will be taken only if the condition of the Plancton0618 strategy will trigger.

ZRX / USDT LONG we have trend line break out in daily and weekly time frame
expecting good profit
good luck


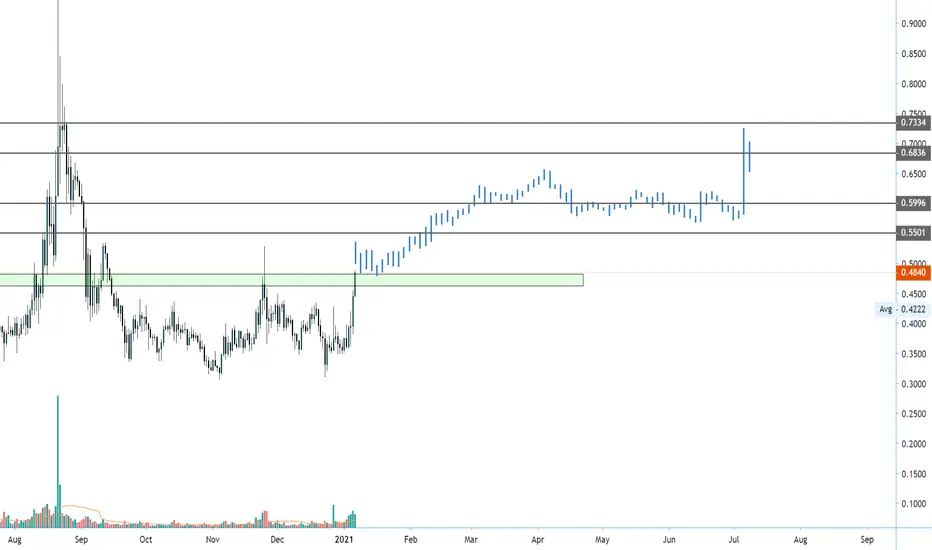
✳️0x/USDT (4-10) #ZRX $ZRX #ZRXUSDTZRX will have the last pump before finding new dips.
ZRX might drop from 0.5$ or 0.65$ so you must pay attention to these levels in this October


ZRXUSDT - Potential buy entry 🔼ZRXUSDT brokeout above the descending triangle inclined resistance.
Price action is printing a minor ascending triangle pattern.
Potential breakout.
Buy entry ⬆️ - breakout above the minor ascending triangle resistance.
Target 🎯 - resistance levels.
Setup invalidation ❌ - breakdown below the minor ascending triangle inclined support.


ZRX LONG...BULLISH TRENDOpening long position here on ZRX as accumulation is near to end...It will soon explode

ZRXUSDT shortRisk warning, disclaimer: the above is a personal market judgment based on published information and historical chart data on Tradingview, all analysis is only subjective. Hope investors consider, I am not responsible for your investment decision. Thank you.
Good luck!


0x (ZRX) - January 1Happy New Year!!!
Dear traders, nice to meet you.
"Like" is a huge force for me.
By "following" you can always get new information quickly.
Thank you for always supporting me.
-------------------------------------------------- -----
We have to see if we can go up along the uptrend line.
You should watch for any movement that deviates from the 0.3260-0.4490 segment.
If it falls from the 0.3260 point, a Stop Loss is required to preserve profit and loss.
If it moves sideways between 0.3260-0.4490, it is expected to create a larger wave with the stored force.
-------------------------------------------------- -------------------------------------------
** All indicators are lagging indicators.
So, it's important to be aware that the indicator moves accordingly with the movement of price and volume.
Just for convenience, we are talking upside down for interpretation of the indicators.
** The wRSI_SR indicator is an indicator created by adding settings and options from the existing Stochastic RSI indicator.
Hence, the interpretation is the same as the conventional Stochastic RSI indicator. (K, D line -> R, S line)
** Check support, resistance, and abbreviation points.
** Support or resistance is based on the closing price of the 1D chart.
** All explanations are for reference only and do not guarantee profit or loss on investment.
Explanation of abbreviations displayed on the chart
R: A point or section of resistance that requires a response to preserve profits
S-L: Stop Loss point or section
S: A point or segment that can be bought for profit generation as a support point or segment
(Short-term Stop Loss can be said to be a point where profits and losses can be preserved or additionally entered through installment transactions. It is a short-term investment perspective.)
GAP refers to the difference in prices that occurred when the stock market, CME, and BAKKT exchanges were closed because they do not trade 24 hours a day.
G1: Closed price
G2: Market price at the time of opening
(Example) Gap (G1-G2)


ZRXUSDT is testing the previous resistance on Fibonacci level 🦐ZRXUSDT is testing the previous support on Fibonacci level. IF the price will flip previous resistance into new support, According to Plancton's strategy (check our Academy), we can set a nice order
–––––
Follow the Shrimp 🦐
Keep in mind.
🟣 Purple structure -> Monthly structure.
🔴 Red structure -> Weekly structure.
🔵 Blue structure -> Daily structure.
🟡 Yellow structure -> 4h structure.
⚫️ Black structure -> <4h structure.
Here is the Plancton0618 technical analysis, please comment below if you have any question.
The ENTRY in the market will be taken only if the condition of the Plancton0618 strategy will trigger.

ZRXUSDT(4HCHART) channel Breakout#ZRXUSDT Technical Analysis Update
Channel Breakout
ZRX/USDT currently trading at $0.4050
LONG ENTRY level: 0.4000 to 0.4140
STOP LOSS: below $0. 3800
Resistance level 1( Target 1): $0.4470
Resistance level 2 (Target 2 ): $0.5130
Max Leverage: 4X
ALWAYS KEEP STOP LOSS...
Follow our Tradingview Account for more Technical Analysis Update, | Like, Share and Comment your thoughts.
