AMianz
EssentialI will put my money in this stock. PERIOD! CAHYA is one of the companies that supply raw materials in construction. They involve in the constructing of PAN Borneo Highway, billions of ringgit telecommunication tower project which was awarded to 5 contractors including them and many more. Don't forget that in Sarawak, the state only accepts local companies with...
My previous analysis based on EW was right at the first place when it bounced at the last 'Z' wave during its correction moves. However, after it manages to rose 8% from the previous low in the Z wave, it started to plummet down and now it has made a lower low that passed the previous correction wave. Based on my Monthly chart analysis, what I see was it is still...
It has completed the final trend wave and it is heading for the final correction wave. Those who still holding their position may want to withdraw while waiting for the final correction wave to complete. We may also see a 30% significant drop in 2 to 3 years.
Looking for long is an ideal decision for now. My base is on Weekly Chart, I would execute my position in either Daily or H4. So for now keep a close eye on these 2 chart, look for the best reversal + momentum.
Although on the prior move, we knew that the KLCI will move lower to the support and trendline area which indicates the final wave (Z) correction and (e) in triangle. We were hoping that the price will bounce on these 2 support lines. It did for at least 2 weeks and moved 32.61 points above. As of now, I will stay neutral on Malaysia's economic, if price breaks...
First I am looking for a long position with a starting point from the highlighted zone below, price expected to reach the Outer Trendline(in blue) before going down to the weekly Support/Demand Zone. Note that both the highlighted Zone are in the fibo level 50 and 61.8. Its a very good confluence for me. Good Luck! Dont forget to Like & Share. Regards, Ejaz Mian
Retracement on the highlighted level looks promising to me + Confluence of Trendline that shows the price is heading up again, probably to the weekly resistance level or even more. Risk Reward 1:4 is my target, in the other words, i put my money til it reach TP 2. What say you? Dont forget to Like and Share this Analysis! Regards, Ejaz Mian
Finger cross that price would retrace at the label level and go down. This is a retrace entry position, as I already made an analysis on the first entry on top. For all of you who are looking to re-entry, this might be a good chance to do it. Good luck! Follow, Like & Share guys! Regards, Ejaz Mian
I am looking for short for this pair. Best is to wait for Candlestick reversal before you entry your position. Look closely for price rejection at the red horizontal line and the red trendline. Good Luck. Dont forget to like and share! Regards, Ejaz Mian
Im am still pro long for this pair. The marking area is the exact area of Fibo 61.8. We will look closely on what price will react at that line. TP would be swing high roughly 200+++ pips. My prediction is price will reject that trendline and go down breaking the Daily sideways.. Finger cross. Please Like & Share fellas.
Here the idea: 1) We will wait for price to reject the Blue Trendline below. Wait for price action there before you enter your position. 2) or, if price break the diagonal (magenta) trendline, most likely it will no go down to the blue trendline, so you can look out for entry after it breaks the magenta trendline. The reason why we are looking for buy is...
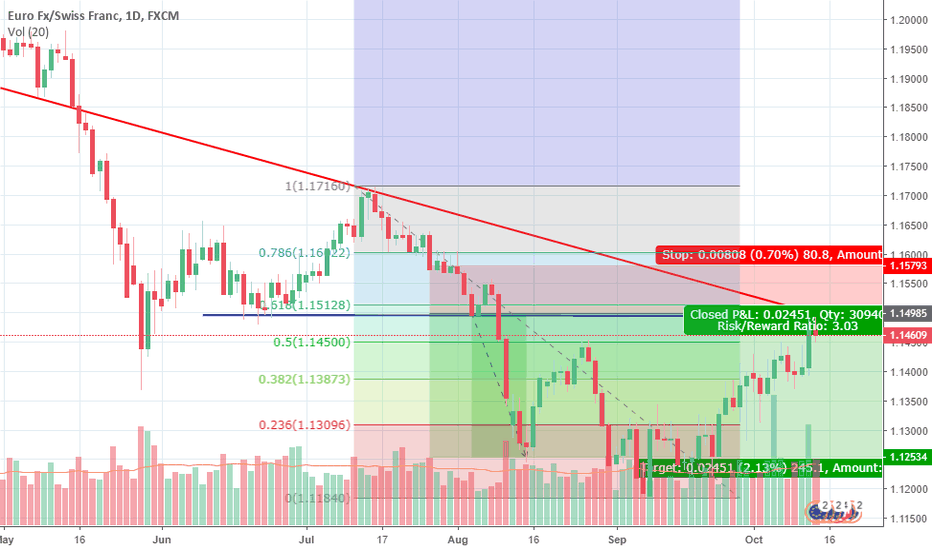
I am looking for short at red line area which also happen to be in the level 61.8 Fibo. Expecting price will turn to resistance before going down to the swing low. Remember to wait for CRS, and never instant sell. Good Luck, Regards, Ejaz Mian
Im looking for long for USDJPY as there are few Price Action in 2H that signal for long. You can take your profit at the level shown above, but as for me, i will wait to TP at the highest high. About 200++ pips or more.
Upon looking at Chart from Weekly down to daily, we can see that price has break and rejected the support zone. If a price close below the support level then goes up again, i call it a Fake Bear Breakout. Let see what will happen next, here is my prediction: 1) Red lines represent the Outer and Inner trendline while the blue line is a connecting line of a low to...
My first time analysis with Tradingview. Price is heading to confluence area that includes Trendline, Support Turn Resistance(STR/SBR) area, and Fibo which we are hoping it to reject at 61.8 level. Remember to wait for Price action before you entry. Expecting to Take your profit at previous swing low. Good luck! Regards, EjazMian


