Abbas_GoatEon
BTC/USD 1D - Well as you can see price has played out exactly as we predicted yesterday providing us with an amazing push to the upside. I do however want to see price correct itself before the next push up. I have gone ahead and marked out the order block I have in mind that I would like to see price come and clear before it continues in this hawkish way. I feel...
Bitcoin has broken above the $91,000 zone, just as we anticipated. On-Chain Insights: • Long-Term Holders: Mild distribution — profit-taking phase • Network Activity: Steady — strong and healthy • Sentiment: Bullish — weak USD and rising institutional inflows Macro Overview: • U.S.–China tensions and Fed uncertainty boost Bitcoin’s safe-haven appeal •...
Hello, traders Gold has been wild yesterday. After hitting ATH of 3500, it went all the way down to 3367. I am expecting the serious correction to take place for a few weeks at least. Currently it opened a gap. I am expecting the gap to be closed. I will sell from 3375, first target will be 3282.
Looking back to last Thursday, our gold short strategy hit the mark perfectly. Prices dropped nearly $60 as expected, and we captured around $45 in profit from that move. Overall, we secured over $200 in profit space last week—an excellent performance. Today, gold opened higher and continues to climb. Technically, bulls still have room to push higher, with 3360...
Current Price Levels: Bitcoin is currently trading around 85,269.35 USDT. Support and Resistance: Support Zones: A crucial support zone marked in green suggests strong buying interest between 80,000 and 81,000 USDT. Resistance: The upper trend line indicates resistance; if Bitcoin can break it, it could target levels close to 88,000 USDT. Bullish Case: A...
A leading diagonal (cLD) has formed on the chart — potentially completing wave A or 1. We're now seeing the development of a corrective wave B/2. Key demand zone: 82,000 – 80,000 This area is supported by: • Fibonacci extensions • VWAP and balance zone • 4H BPR • Strong volume cluster (profile-based) This is a local setup, but if confirmed, it may kick off...
Gold has successfully broken above its resistance zone and the top of the ascending channel, indicating strong bullish momentum. Two support zones have been identified below the current price. A correction toward one of these levels is expected before the next bullish leg begins. After a pullback to one of these support areas, we expect gold to resume its uptrend...
Hello, traders Gold make a correction and still looking for a strong support, to make a bullish continuation.
Hello, traders This chart is an insightful visual representation of technical analysis for the Gold Spot price (XAU/USD) against the U.S. Dollar. Based on its design, it seems geared toward identifying potential price movement patterns and decision points for trading. Here are some key takeaways: 1. **Fibonacci Retracement Levels:** Highlighted at 0.618 and...
As of April 12, 2025, Bitcoin (BTC) is trading at approximately $84,892, reflecting a 1.5% increase as it attempts to break a three-month downtrend. Several factors have contributed to Bitcoin's recent price surge: 1. U.S. Tariff Exemptions: The Trump administration's decision to exempt key tech products from reciprocal tariffs has alleviated trade tensions,...
Overall swing structure of Bitcoin is sill bullish, but currently price is bearish in order to facilitate an internal structure pull-back. For Bitcoin to have a valid Break-Of-Structure, price have to retrace back to the discounted demand price zone of the previous valid Swing Break-Of-Structure ($63k - $55k zone). However, when price get to this demand zone, the...
As predicted, we expected a 5-wave formation, which happened, and with the formation of a divergence between waves 3 and 5, the price of gold fell. Now a small wave with 5 parts has formed, which could be wave A of a zigzag. We expect the price to grow by 61.8% of the decline that occurred in the main wave B. Now, considering the psychological support of $3,000,...
The price is falling towards the pivot which acts as a pullback support that lines up with the 38.2% Fibonacci retracement and could bounce to the 1st resistance. Pivot: 80,393.27 1st Support: 77,842,40 1st Resistance: 84,559.23
Hello, traders 50-day moving average (red line): This is a short-term trend indicator. It reacts more quickly to price changes and is often used to identify short-term trends. When the price is above this moving average, it usually indicates bullish momentum; when it is below, it may signal bearish momentum. 200-day moving average (green line): This is a...
I’m eyeing a potential long opportunity on Gold in the 3030–3045 zone, but only with proper confirmation. The shiny metal has broken and closed above Monday’s high with strong momentum, signaling short-term strength. However, considering the overall short-term bearish bias, I anticipate a pullback toward the 78.6% Fibonacci retracement level. Here's the plan: ...
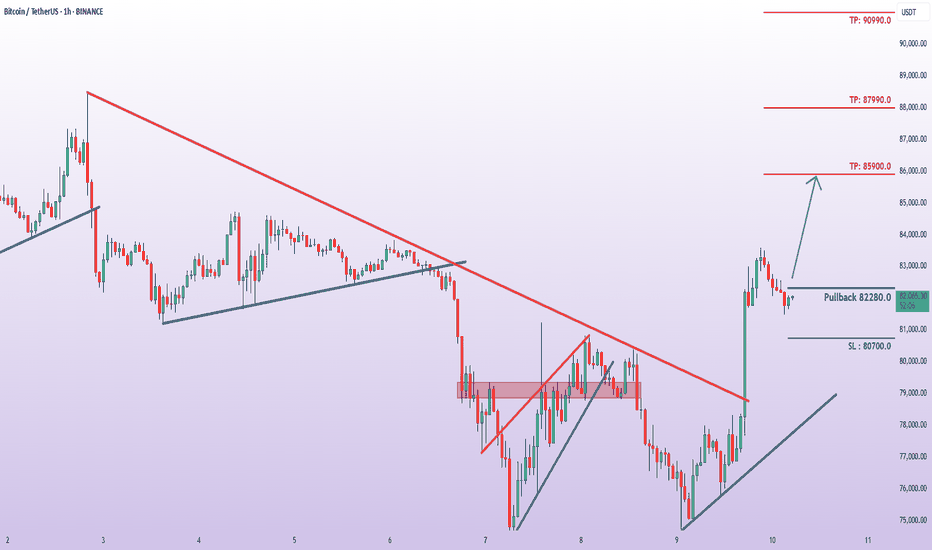
Buy now or Buy on 82280.0 SL @ 80700.0 TP1 @ 85900.0 TP2 @ 87990.0 TP3 @ 90990.0 What are these signals based on? Classical Technical Analysis Price Action Candlesticks Fibonacci RSI, Moving Average , Ichimoku , Bollinger Bands
Hello, traders Bitcoin from the 1hr pov will drop to the area between $78850 - $77555 to then bounce and continue higher but just to test the $82865 Res line, and as long as the Daily is in extended Bearish mode every bounce will be short lived to then continue lower until the Daily exits the Bearish mode.
- Gold prices just hit a record high, soaring past $3,085 per ounce in March 2025. That’s not just a number—it’s a warning sign. Investors aren’t piling into gold for no reason. They’re reacting to a world that feels more uncertain by the day. - The U.S. has imposed heavy tariffs on Canada, Mexico, and China, triggering trade tensions that are shaking global...


