This 1-hour Bitcoin (BTC/USD) chart shows a clear recovery from recent lows, breaking through a resistance zone around $115,000. The projected red path suggests a bullish continuation toward the $117,000–$119,000 area, supported by a parabolic curve and upward trendlines. However, the price is currently facing resistance near $117,000, as indicated by the minor...
This 15-minute chart of Bitcoin (BTC/USD) shows a strong bullish recovery from the support zone near 117,200 (blue horizontal line). Price has formed a bullish continuation pattern (potential ascending triangle or flag) supported by the red trendline. The gray curved arrow suggests a projected bullish breakout toward the 119,600–119,800 resistance area. The...
This is a 15-minute Bitcoin (BTC/USD) chart showing a potential bullish breakout scenario. Price has broken above a key resistance zone (gray shaded area) and is forming a possible bullish continuation pattern (ABCD structure). The red projection indicates a bullish price target towards the 119,750–120,000 USD resistance area (blue line). Confirmation of breakout...
The chart displays Bitcoin (BTC/USD) on the 1-hour timeframe with clear horizontal support and resistance levels. A potential bullish harmonic pattern (likely a Bullish ABCD or Bat pattern) has formed, completing near the 117,200 support zone. Price is consolidating within a descending wedge, indicating potential reversal or breakout. Watch for a bounce from...
The chart shows Bitcoin (BTC/USD) on the 15-minute timeframe. Price is currently trading within an ascending channel after rebounding from a support zone around $117,200. It's approaching a key resistance area near $118,200, which aligns with the mid-channel line. A breakout above this resistance could signal bullish continuation, while rejection might lead to a...
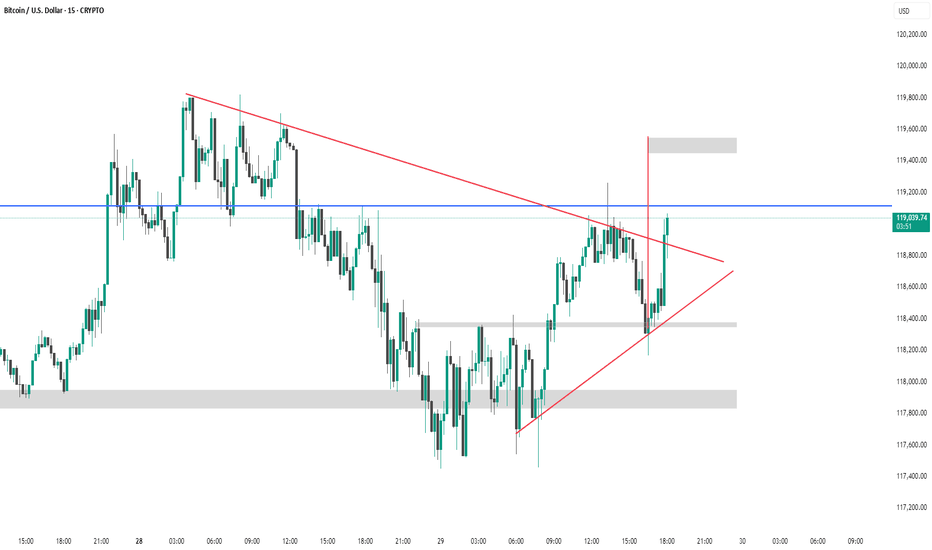
This 15-minute chart of Bitcoin/USD shows a symmetrical triangle breakout pattern. Price recently broke above the upper red trendline resistance, suggesting bullish momentum. Key highlights: Breakout candle is strong and closes above the resistance zone (~$119,000). Next potential target is near the upper grey supply zone (~$119,500), based on the triangle’s...
This Bitcoin (BTC/USD) 15-minute chart shows a symmetrical triangle breakout. The pattern labeled A-B-C-D indicates consolidation within the triangle, followed by a bullish breakout. The price has broken above the upper trendline and is approaching the resistance zone around 118,800–119,400 USD. The chart suggests two scenarios: Immediate breakout to the 119,400...
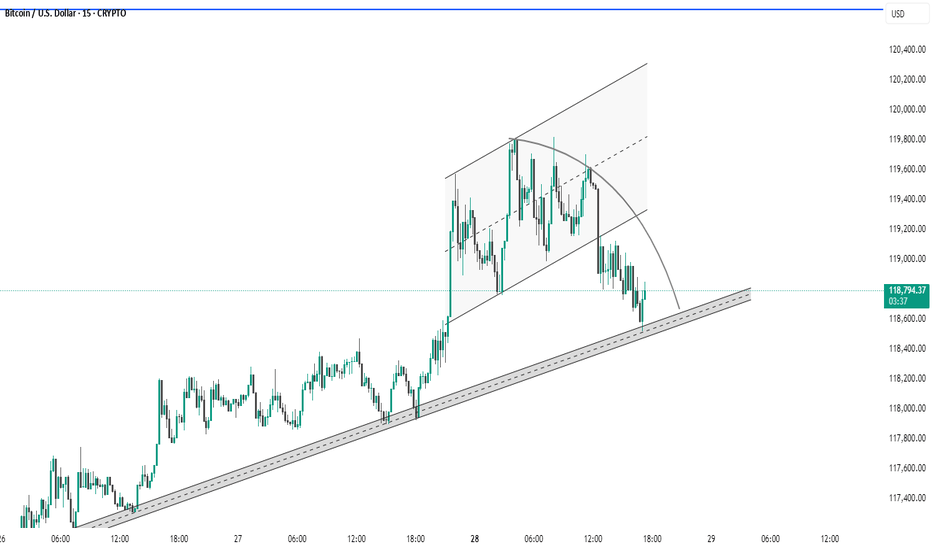
This 15-minute BTC/USD chart shows a clear breakdown from a rising channel, followed by a retest and rejection at the former support trendline. The price has now broken below key trendline support and is testing a demand zone near 118,000 USD. If this level fails to hold, the next support lies around the 117,250–117,000 USD zone. This indicates a potential shift...
This 15-minute BTC/USD chart shows a rising channel formation that has recently been broken to the downside, indicating potential bearish momentum. The price is currently testing a long-term ascending trendline, acting as a critical support zone around $118,600–$118,800. A breakdown below this trendline could lead to further downside, while a bounce could suggest...
The chart shows Bitcoin (BTC/USD) on a 30-minute timeframe. Price recently broke down from a rising channel and is currently testing a key ascending trendline for support around $118,600. A break below this trendline could signal further downside, while a bounce may lead to another test of the $120,000 resistance level. Traders should watch closely for a confirmed...
This Bitcoin (BTC/USD) 30-minute chart shows a recent breakout above a descending trendline (red) and an ascending wedge pattern. Price has broken out of a rounding structure, indicating a potential bullish reversal. The breakout candle is strong, suggesting bullish momentum. Key resistance lies near 120,000 (blue horizontal line), while support is around 115,600....
This Bitcoin (BTC/USD) 30-minute chart shows a recent breakout above a descending trendline (red) and an ascending wedge pattern. Price has broken out of a rounding structure, indicating a potential bullish reversal. The breakout candle is strong, suggesting bullish momentum. Key resistance lies near 120,000 (blue horizontal line), while support is around 115,600....
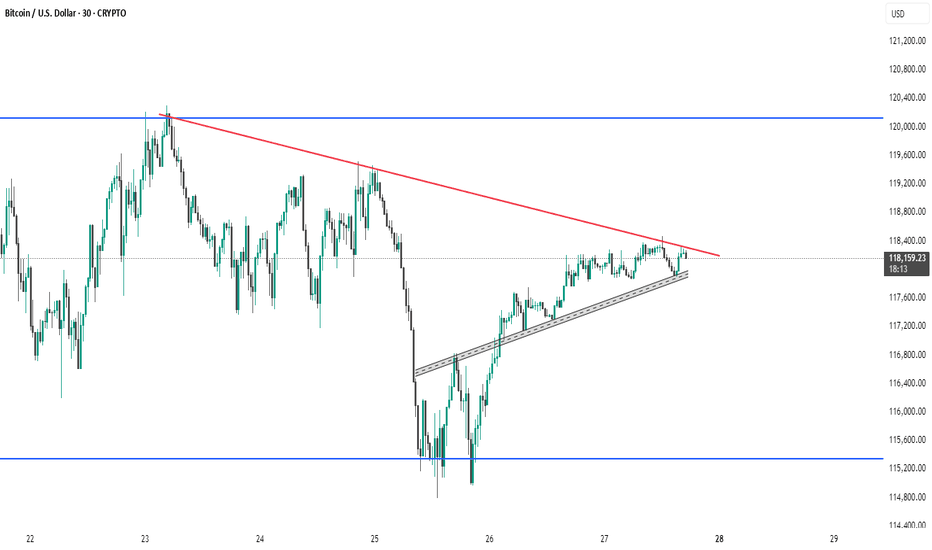
This Bitcoin (BTC/USD) 30-minute chart shows a symmetrical triangle pattern forming, with price action compressing between a descending resistance (red trendline) and an ascending support (gray trendline). The price is currently near the apex of the triangle at $118,149, suggesting a potential breakout or breakdown soon. Key support and resistance levels are...
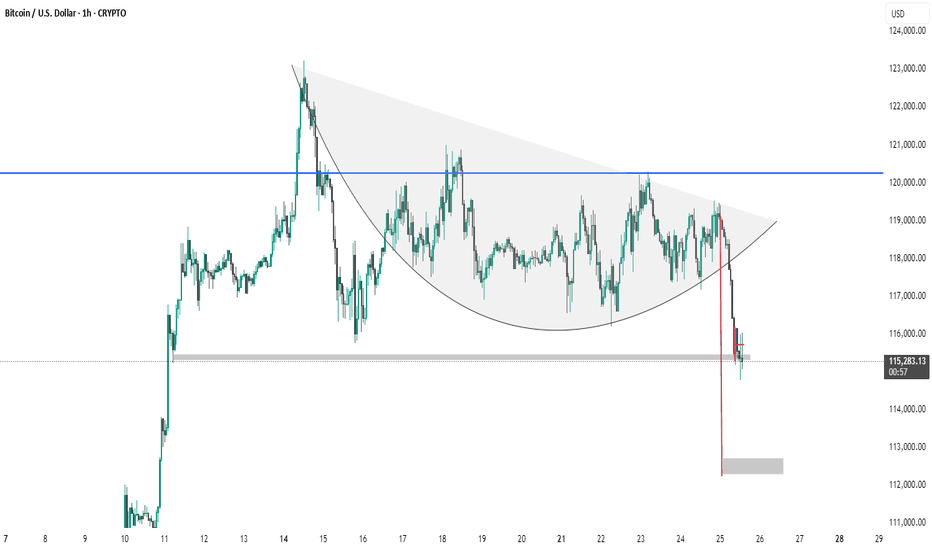
The chart shows a bearish breakdown from a rounded top formation, indicating a shift from an uptrend to a downtrend in Bitcoin (BTC/USD) on the 1-hour timeframe. Price broke below a key support zone ($116,000), confirmed by a sharp red candle. The shaded area below ($112,500) suggests the next potential support or target zone. This pattern reflects weakening...
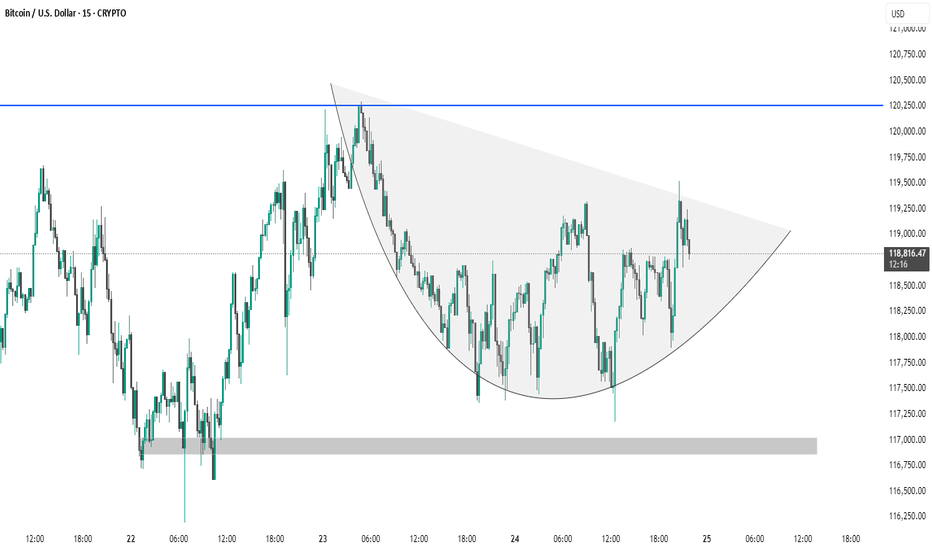
The chart depicts a 15-minute Bitcoin (BTC/USD) price action forming a cup and handle pattern, which is generally considered a bullish continuation pattern. The rounded base signifies consolidation, followed by a potential breakout above the $120,250 resistance zone (blue line). A breakout with volume could confirm upside momentum. The shaded grey area below...
The chart shows Bitcoin (BTC/USDT) on a 1-hour timeframe forming a symmetrical triangle pattern, marked by points A, B, C, and D. This consolidation pattern indicates potential for a breakout as price volatility contracts. Key support is around $117,000, and resistance is near $120,000. A breakout above or below the triangle could signal the next major move....
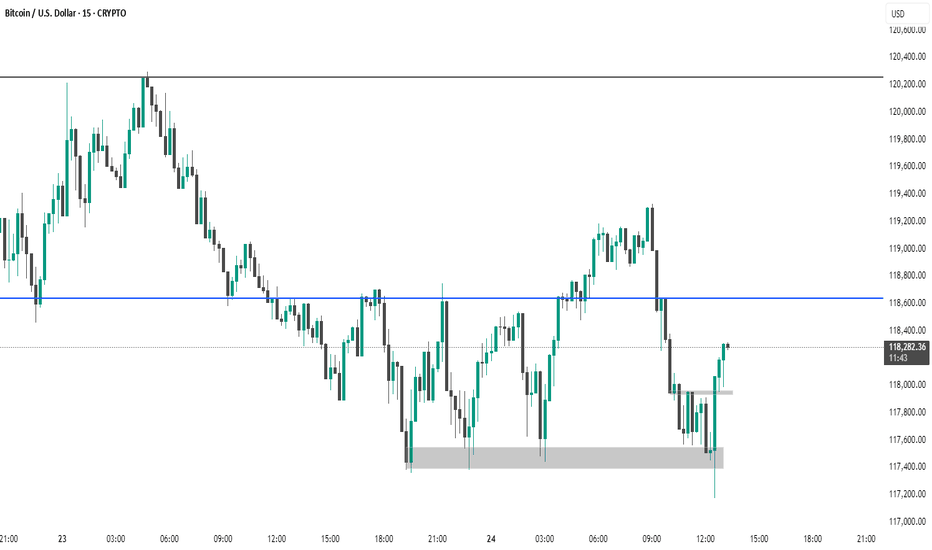
This 15-minute Bitcoin (BTC/USD) chart shows a recent bullish reversal from a strong demand zone (highlighted in grey near $117,400). Price broke above a minor resistance (grey zone around $118,000) and is currently following an upward trendline. The next key resistance is around $118,600 (blue horizontal line), which may act as a target or reversal point. Bulls...
This 15-minute BTC/USDT chart shows a key breakout structure: Ascending trendline (red) supported price before a breakout. Horizontal line marks a previous resistance turned support post-breakout. Vertical red line represents the breakout height. 50% retracement level of the breakout move is highlighted — a critical area for potential price reaction. Price is...


