This Bitcoin (BTC/USDT) 1-hour chart shows two clear consolidation phases marked by blue rectangles. Each consolidation lasted 164 bars (~6 days 20 hours). After the first range, Bitcoin broke out upwards, leading to a strong rally. The current price action is again testing the upper boundary of the second consolidation range ($119,200), indicating a possible...
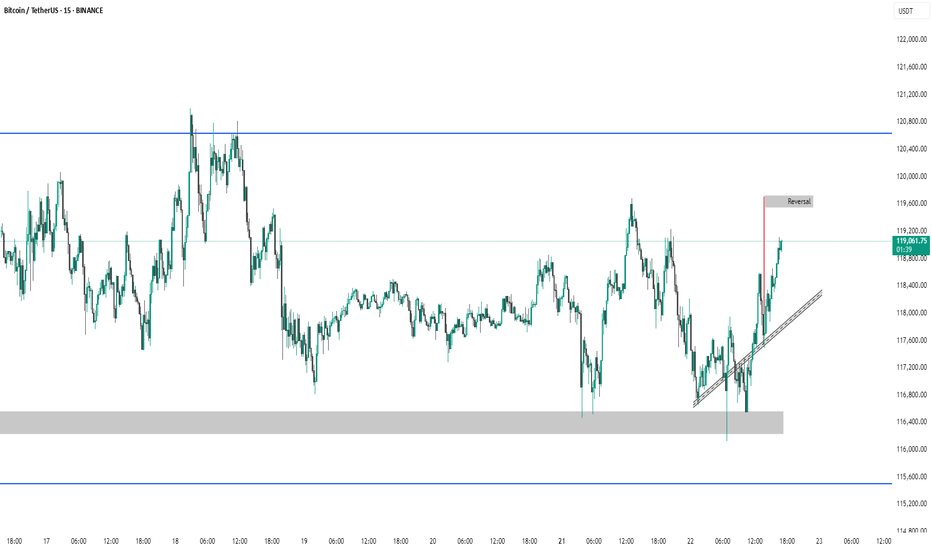
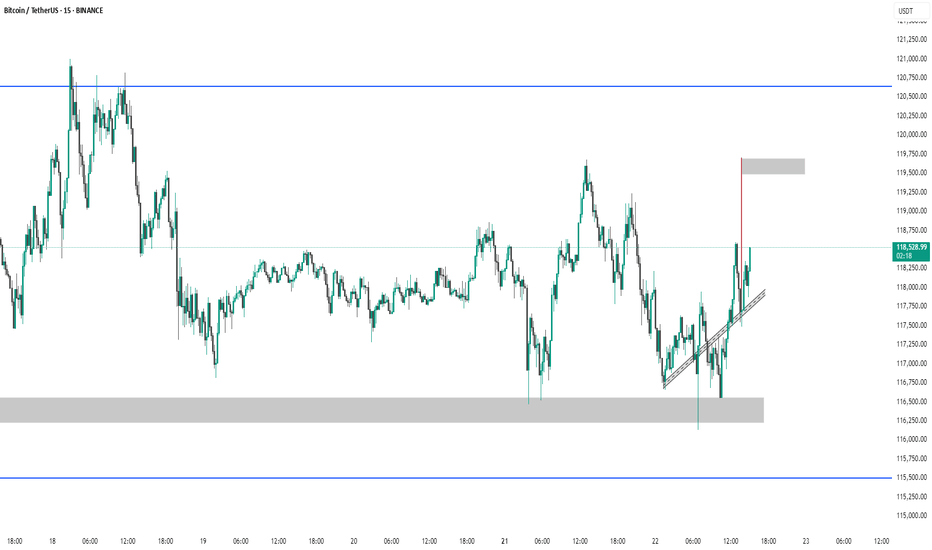
This 15-minute BTC/USDT chart (Binance) shows Bitcoin rebounding from a demand zone near 116,000–116,750 USDT and forming higher lows along a short-term ascending trendline. Price is currently around 118,446 USDT, aiming toward a marked supply zone near 119,500 USDT, suggesting a potential short-term bullish move. A rejection at this supply zone could signal a...
This 15-minute BTC/USDT chart (Binance) shows Bitcoin rebounding from a demand zone near 116,000–116,750 USDT and forming higher lows along a short-term ascending trendline. Price is currently around 118,446 USDT, aiming toward a marked supply zone near 119,500 USDT, suggesting a potential short-term bullish move. A rejection at this supply zone could signal a...
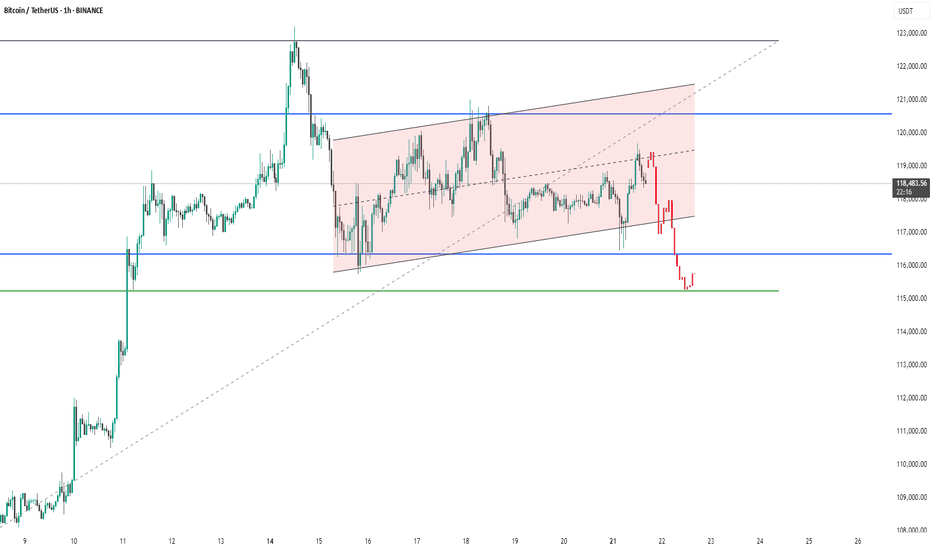
This 1-hour Bitcoin/USDT chart from Binance shows a recent breakdown from a rising parallel channel (highlighted in pink). Price action broke below the lower trendline and a key support zone (grey area), indicating a bearish shift. The strong red candles signify increased selling pressure. The next major support lies near 115,500 USDT (blue horizontal line), which...
The chart shows Bitcoin (BTC/USDT) on a 1-hour timeframe experiencing a breakdown from an ascending channel (highlighted in pink). After reaching resistance near $120,800, price sharply declined, breaking below both the channel support and the key horizontal support around $117,000 (blue line). It is now testing the next support zone around $115,000 (green line)....
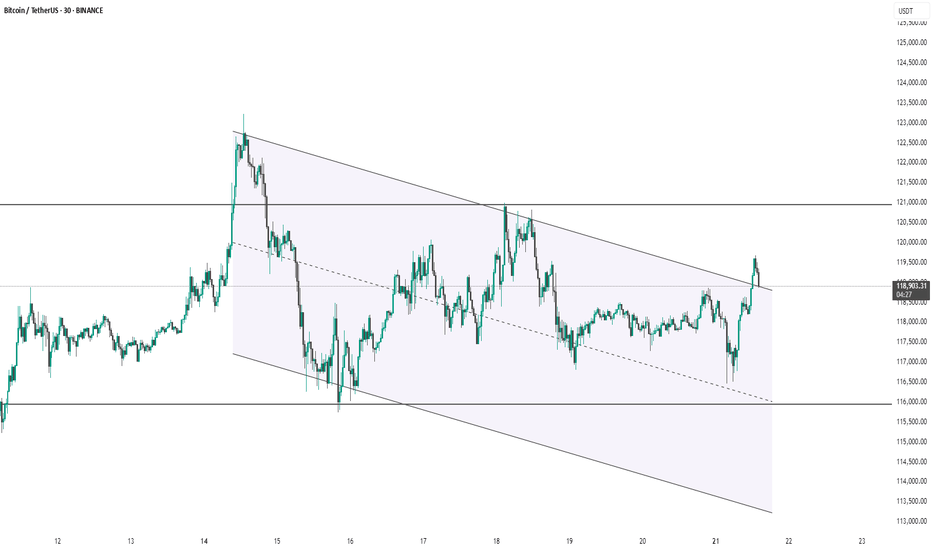
This Bitcoin (BTC/USDT) 30-minute chart shows price action within a descending parallel channel. Recently, the price broke out above the channel's upper boundary, suggesting a potential bullish breakout. However, the price has slightly pulled back, now retesting the breakout zone near $119,000. Holding above this level may confirm the breakout and lead to further...
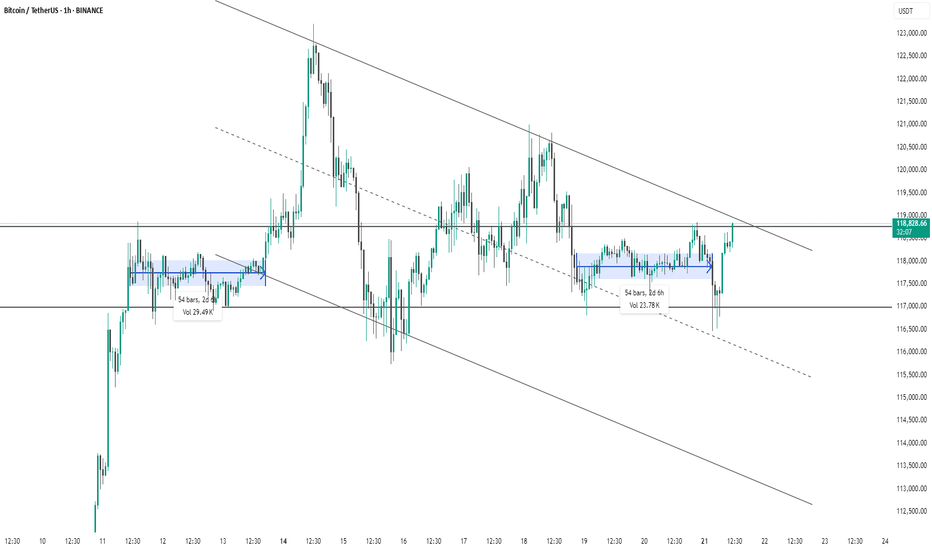
This 1-hour chart of Bitcoin/USDT (Binance) shows a descending channel pattern with clearly defined upper and lower trendlines. Price has recently broken out of a consolidation zone (highlighted in blue) and is now testing the upper boundary of the descending channel near $119,000. The breakout from the recent range (lasting 54 bars / 2d 6h with 23.78K volume)...
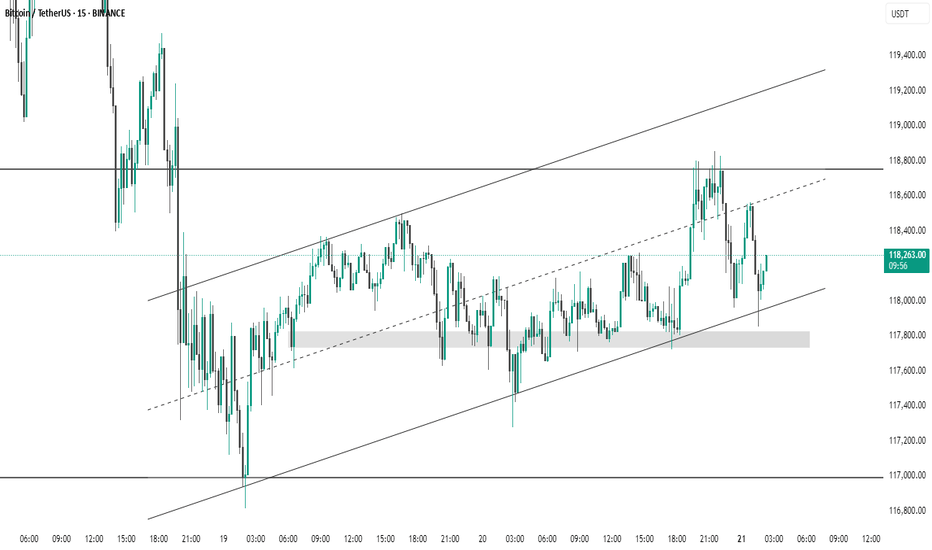
This 15-minute BTC/USDT chart from Binance shows Bitcoin trading within an ascending channel. Price recently bounced off the lower trendline and a highlighted demand zone around 117,800 USDT, suggesting strong support. The upper channel and resistance near 118,800 USDT may act as potential targets. Short-term momentum appears bullish as long as price holds above...
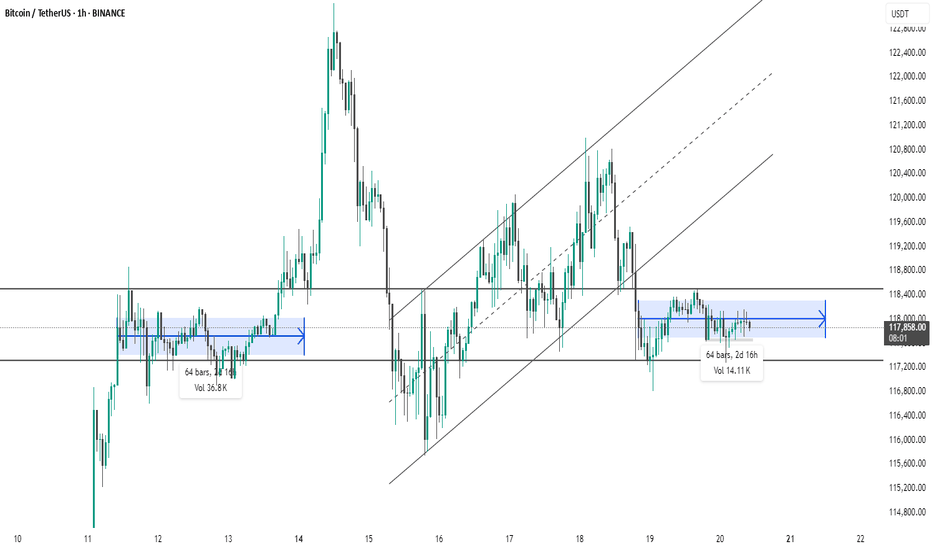
This chart shows Bitcoin (BTC/USDT) on the 1-hour timeframe, highlighting two periods of sideways consolidation (marked in blue). Both zones lasted 64 bars (2d 16h), indicating similar market indecision or accumulation/distribution phases. The first consolidation (left) was followed by a strong bullish breakout, while the second (right) is currently...
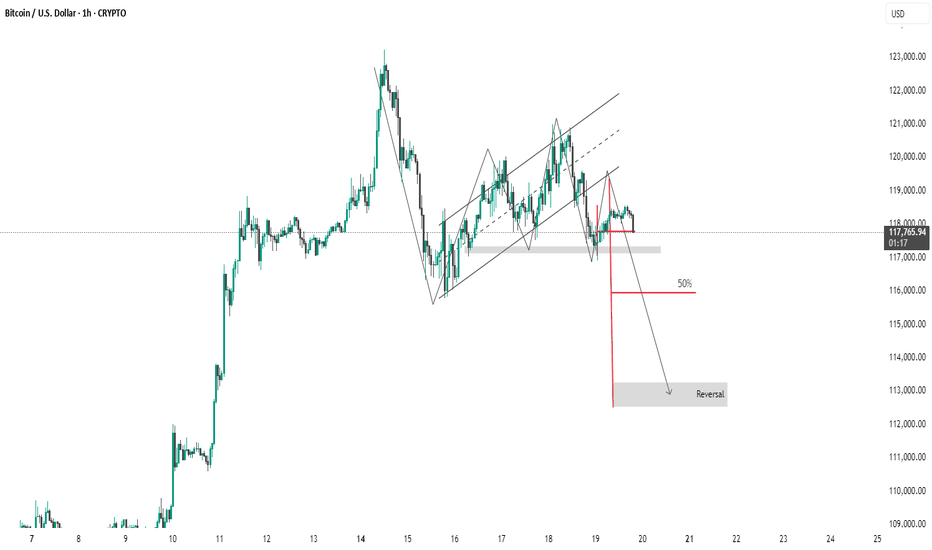
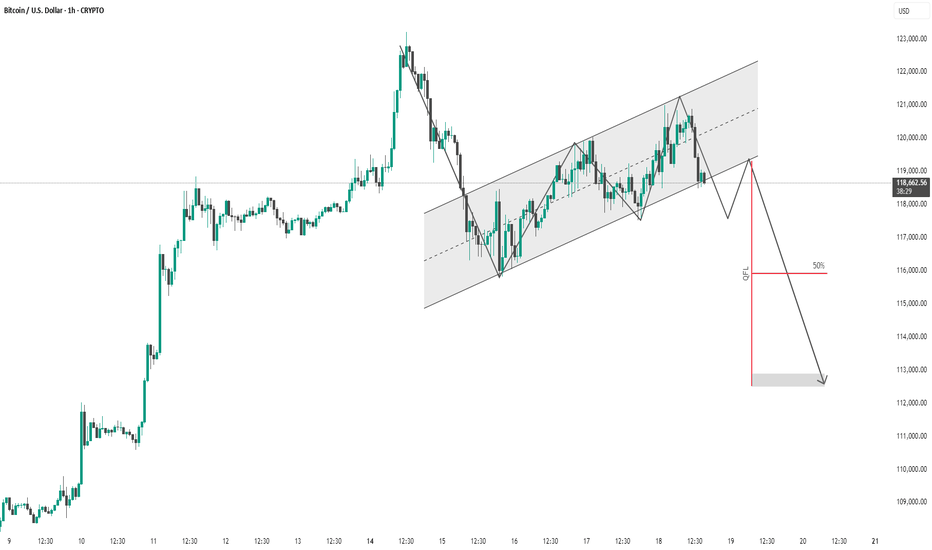
This 1-hour Bitcoin (BTC/USD) chart shows a bearish setup following a breakdown from a rising channel. Price is currently testing a support zone around $117,000. A potential continuation move is projected down toward the $113,000–$114,000 area, where a reversal is anticipated. The red arrow indicates the expected bearish move, supported by prior structure and...
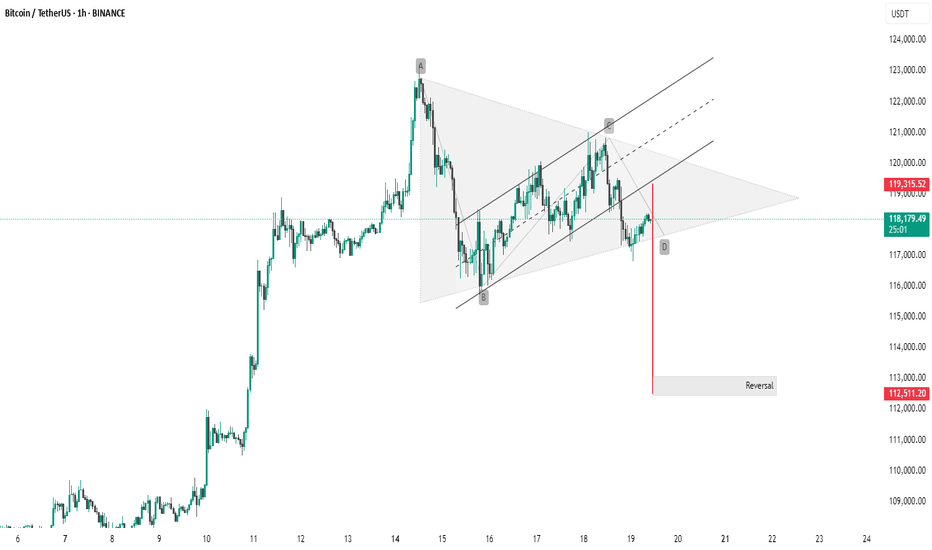
This Bitcoin (BTC/USDT) 1-hour chart shows a bearish breakout from a symmetrical triangle or rising wedge pattern. The breakout is confirmed by a strong red candle below the lower trendline, suggesting downward momentum. Pattern: Bearish wedge/triangle. Breakout Level: ~118,000 USDT. Target Zone: Around 112,511 USDT, marked as a potential reversal...
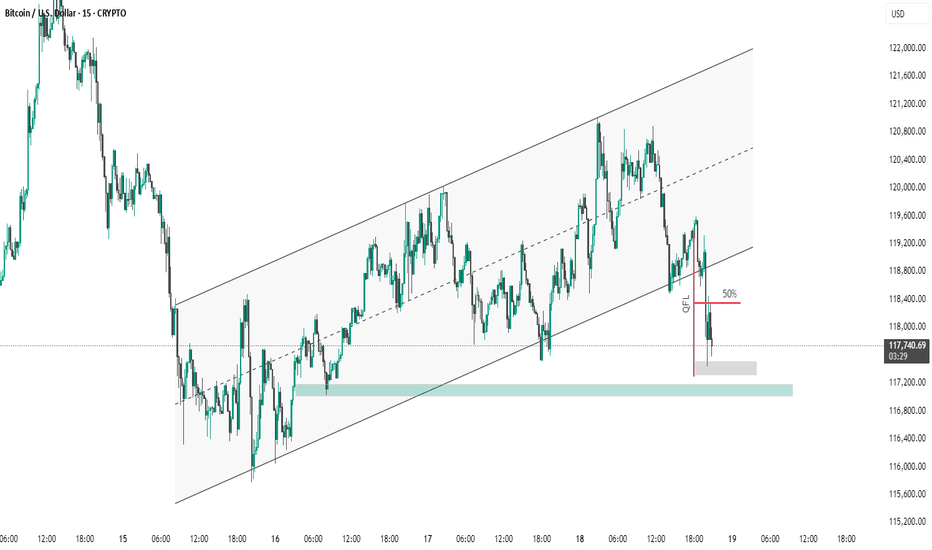
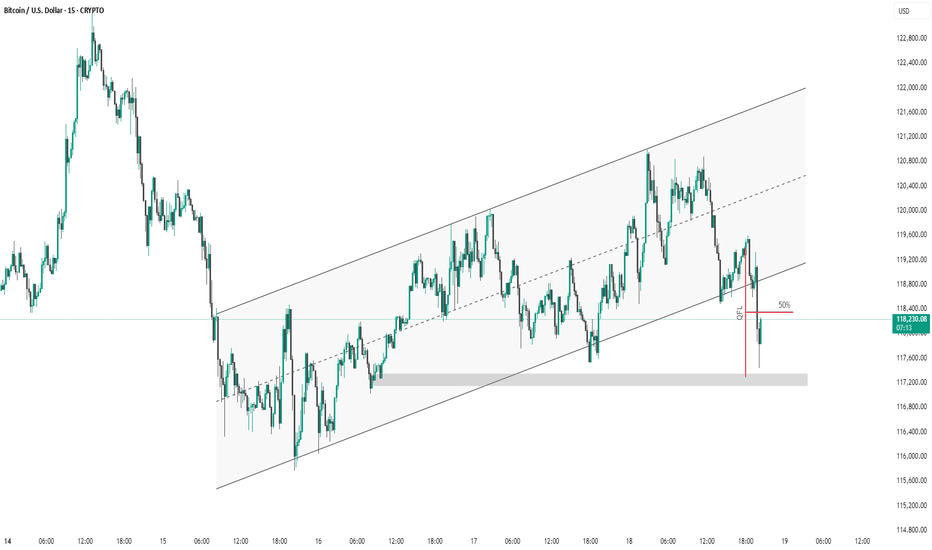
Short Note on BTC/USD (15-Min Chart): Bitcoin recently broke down from an ascending channel, signaling a shift in momentum. After forming a QFL base, price failed to hold above the 50% retracement level and is now testing a key demand zone around $117,200. A bounce from this level is possible, but a breakdown below may open the path toward $116,000–$115,000....
This 15-minute BTC/USD chart shows price action within an ascending channel. Recently, Bitcoin broke below the channel's midline and dipped to a key demand zone (highlighted in grey), triggering a liquidity grab (marked as "GFL"). Price has since retraced to the 50% level of the drop, which may act as resistance. A failure to reclaim the channel could indicate...
This 15-minute Bitcoin (BTC/USD) chart shows price action within an ascending channel. Recently, the price broke below the midline and touched the lower channel boundary, bouncing back slightly afterward. A marked "QFL" (Quick Flip Level) zone with a 50% retracement is highlighted, suggesting a potential area of interest for buyers or a price reaction point. The...
This is a 1-hour chart of Bitcoin (BTC/USD) with a clear bearish outlook indicated by the analysis: Key Observations: Rising Channel: Price has been moving inside an ascending channel. Currently testing the lower boundary, suggesting potential for a breakdown. Price Projection: A sharp drop is anticipated after breaking the channel, supported by the downward...
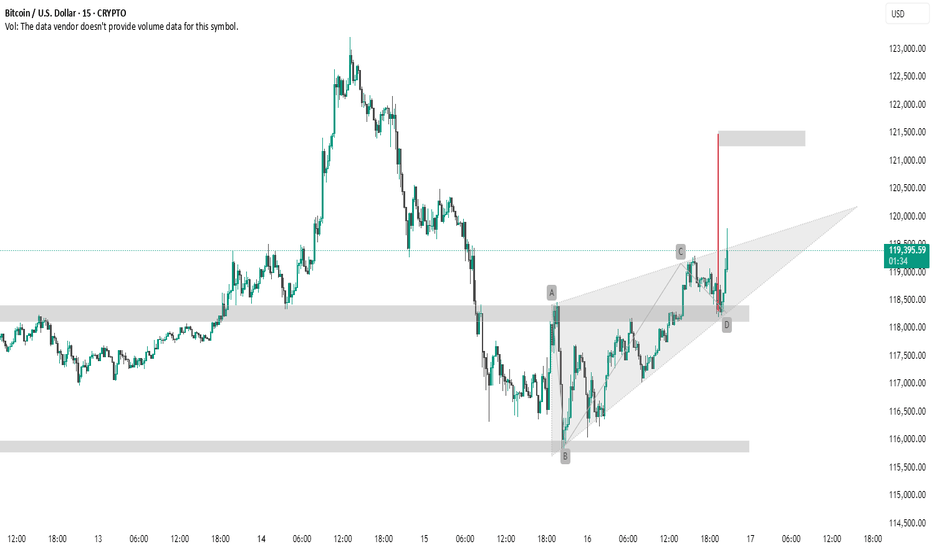
This 15-minute BTC/USD chart presents a **bullish breakout** from a **rising wedge pattern**, which typically has bearish connotations but in this case broke upward — suggesting strong buying pressure. Key Observations: * **AB=CD Pattern**: The chart shows a completed harmonic AB=CD pattern, typically a **reversal** or **continuation** signal, depending on...
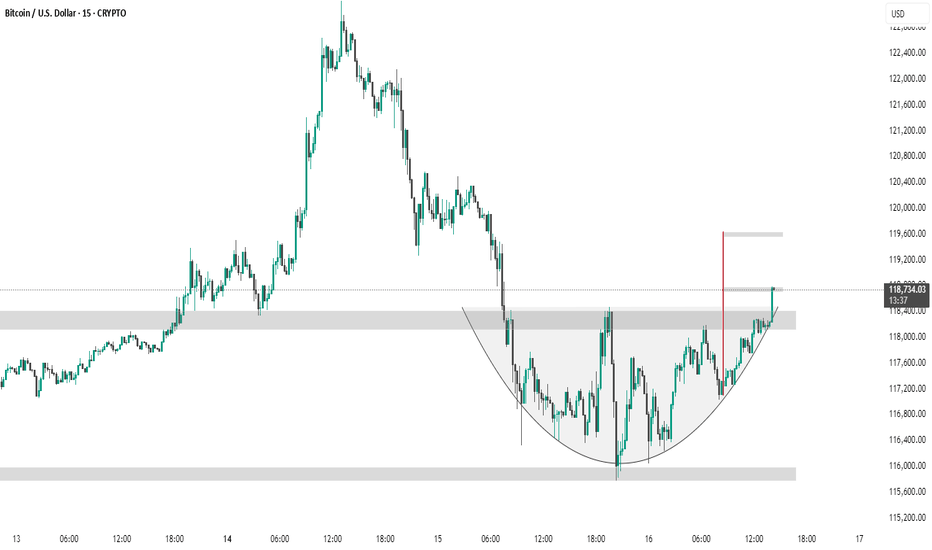
The chart shows a 15-minute BTC/USD timeframe forming a cup and handle pattern, a bullish continuation signal. Price has broken above the handle resistance zone (~$118,400), suggesting a potential breakout. The red vertical line marks the expected target, projecting a move toward the $119,600 level based on the pattern height.
The chart **15-minute Bitcoin (BTC/USD)** candlestick pattern with a clearly drawn **cup and handle** or **rounded bottom** formation. Let's identify key levels: --- 🔍 **Key Levels Identified:** 1. **Resistance Zone (Neckline of Cup)** Level:** \~**118,400 USD** Significance:** This is the upper gray zone where price has repeatedly been rejected. It's acting...

