Adam_hazouri
The price is on a uptrend on the daily chart. It is in a consolidation area, reached the lower support area of it. The price formed a /Double Bottom/ pattern and broke the neckline.
The Price is in a down trend on the daily chart. It is in a pullback made a high but it couldn't make a higher high and broke the support range around /103.600/, retesting now. The target area is around /103.700/
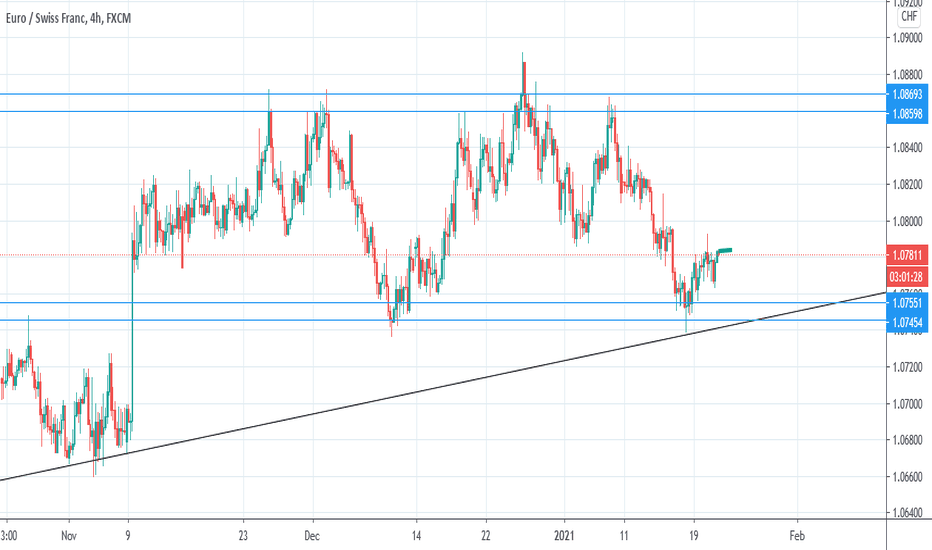
The price reached a strong support around /1.07500/ and it has also support from the daily uptrend. The target is the resistance area around /1.8600/.
The price formed /Head&Shoulder/ pattern, and broke down the neckline at /0.71611/ and it also broke the uptrend line. The Price is retesting the resistance now and most likely to continue down. The Target level is at /0.70230/.
The Price reached a monthly support.
The price reached a monthly support and formed /Double Bottom/ pattern.
The price formed the /Inverse H&S/ pattern. The right shoulder is higher than the left one, which gives the pattern more strength. If the price beak out the neck line then the long trade is active.
The price broke up the down-sloping channel, and retested the upper trend line.
The price formed H&S chart pattern and broke the neckline.
The price is trading in an ascending channel since September last year. On the 4H time frame, the price was moving in congestion area and then broke up. I think the price is likely to go up. This is the Daily look:
The price reached the weekly uptrend and made a pin bar on the 4H time frame . I think it is the right time to go long. Here is the weekly view.
The price broke down the up trend and retested it. At the same time it broke the resistance of /109.000/.
The Price broke the weekly uptrend and tested it twice and reverse with a long tailed pin bar. If the Price break and close under the support level of /1.05446/, the selling trade will be active. Here is the weekly view. I see that the price can hit the low of /1.01000/ but I won't open a long term trade.
The Price was in a strong Down Trend, it it reached strong weekly resistance zone. The Price formed the reversed H&S pattern. I think the price is likely to reverse and go higher even more than the target I put.
The price is moving in a descending channel. The price formed a triangle and broke the uptrend and it is testing the resistance.
The Price is trading in an ascending channel. It reached the upper trend line, tried to break out but reversed with long pin bar on the 2nd of January. The price also formed /Head&Shoulder/ pattern and broke the neckline, but I'm waiting til the close under /1.59551/.
The price was in consolidation area, and broke down the lower resistance. The short trade will be active if the price break down the level of /0.89190/ and close.
The Price formed /Head&Shoulder/pattern and broke the neckline.


