AlexeyWolf
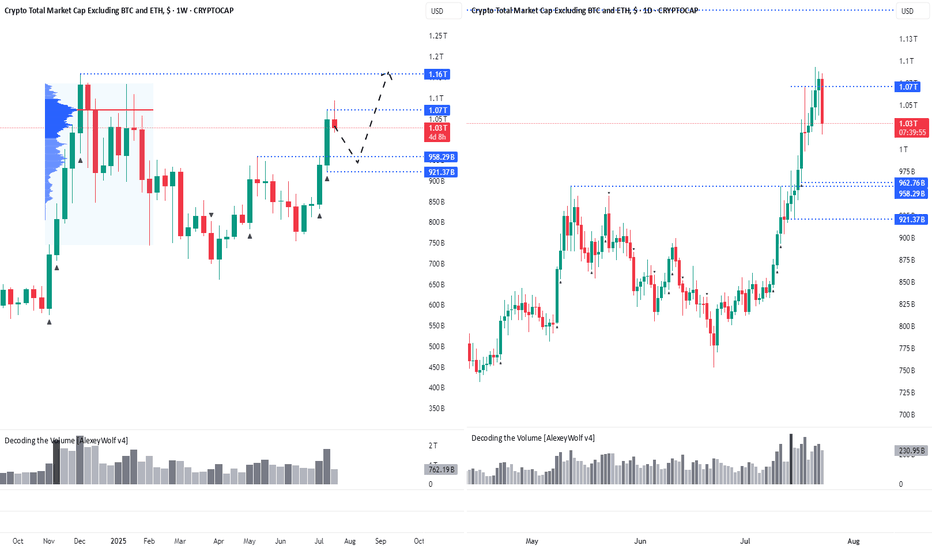
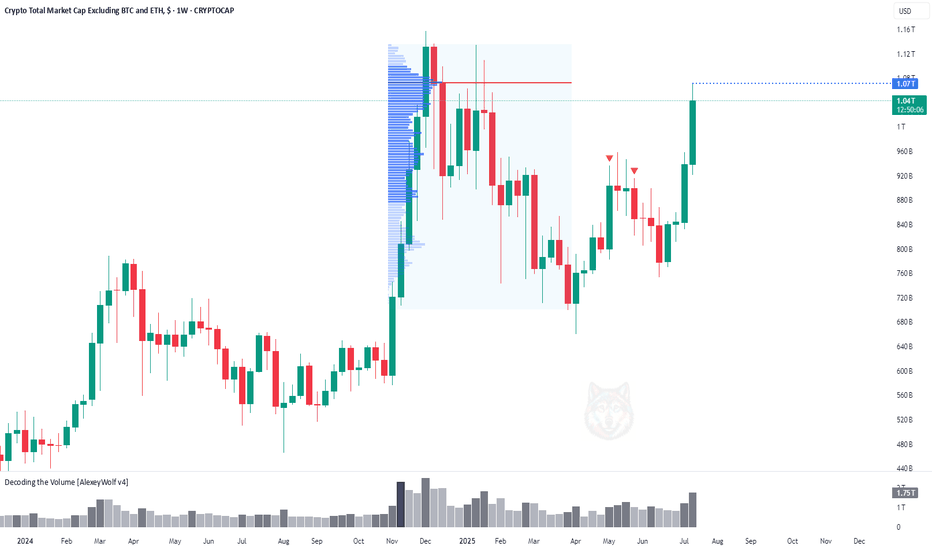
PremiumHi traders and investors! The market capitalization of Total3 has reached $1.07 trillion, marking the first major target for the altcoin market. This level corresponds to the Point of Control (POC) from the previous bullish rally and the subsequent correction — a key area of traded volume and market interest. Several factors now suggest the potential for a...
Hi traders and investors! The market capitalization of Total3 has reached $1.07 trillion, marking the first major target for the altcoin market. This level corresponds to the Point of Control (POC) from the previous bullish rally and the subsequent correction — a key area of traded volume and market interest. Several factors now suggest the potential for a...
Hi traders and investors! The 3310 level worked out perfectly. We can see a familiar buy pattern forming. If the buyer fails to push the price higher and the seller returns to the 3310 level, it's likely that the price will continue to decline on the daily timeframe toward the next nearest targets — 3244, or more likely, 3154. For now, however, we still expect...
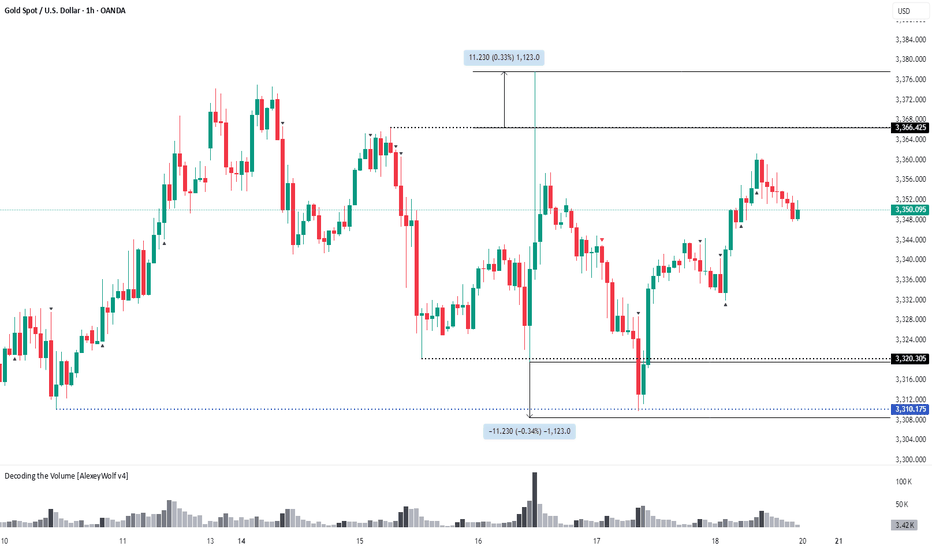
Hi traders and investors! The price is currently in a sideways range, with the boundaries marked by black lines. Sellers defended the buyer's first attempt to break through the 3366 level — the key volume in the candle that touched this level was accumulated exactly at that point. Now, it would be ideal to symmetrically expand the range downward by 11.230...
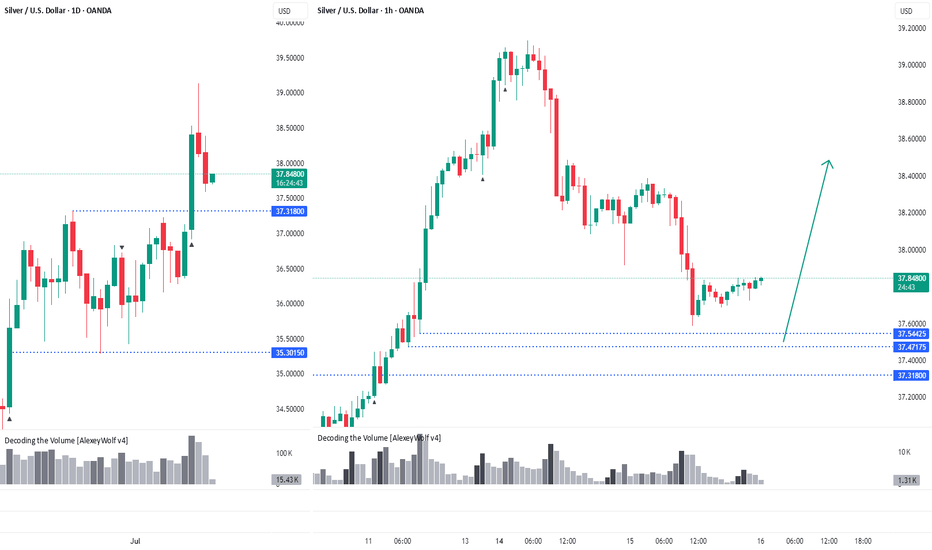
Hi traders and investors! On the daily timeframe, the price has broken out of the sideways range through the upper boundary at 37.31. The price has pulled back close to levels where potential buy patterns could form — 37.54, 37.47, and 37.31. This analysis is based on the Initiative Analysis concept (IA). Wishing you profitable trades!
Current scenario range — can shift depending on how the market reacts next. This analysis is based on the Initiative Analysis concept (IA). Wishing you profitable trades!
Hi traders and investors! On the daily timeframe, OPUSDT is trading in a sideways range. The price has repeatedly dipped below the lower boundary at 0.545, but each time, buyers managed to bring it back. Now, we’re seeing another attempt to return into the consolidation zone — a possible sign of renewed buyer initiative. If the price secures above 0.545, the...
Hi traders and investors! Buyers have reached the first target at 108,952. On Binance spot, BTC missed the second target (110,530.17) by just 99 cents. Is this a setup for a breakout and a run toward a new ATH? So far, the price action looks like a level manipulation around 108,952: volume in all 3 bars interacting with this level is concentrated above...
Sometimes you feel like you know it all. You've tried dozens of strategies. Studied with the best. But in your head — there’s no clarity, in your trades — chaos, and in the end — you’re stuck in the same place. I’ve been there too. If this sounds familiar — keep reading. Every day, thousands of traders enter the market and do everything "by the book": they open...
Hey traders and investors! The seller has reached their target. A buyer started buying from the 2184 level and now holds the initiative. Targets are on the chart. This analysis is based on the Initiative Analysis concept (IA). Wishing you profitable trades!
Hey traders and investors! Hourly Timeframe 📍 Context The hourly chart is in a sideways range. Currently, the buyer has the initiative, potential target 36.55. 📊 Key Actions The 35.30 level on the hourly timeframe has worked well. This level marks the correction extreme within the dominant buyer initiative (i.e., an initiative where the correction is...
Hey traders and investors! 📍 Context On the daily timeframe, the market is in a sideways range. The boundaries are marked with black lines. Buyer initiative is currently active. Targets: 108,952; 110,530; 111,980. 📊 Key Actions The seller attempted twice, on increased volume, to break down below the range, but both times the buyer brought the price back...
Hey traders and investors! Daily Timeframe Market phase : sideways. Seller's initiative. Boundaries marked with black lines. Gold followed an alternative scenario from the previous review toward 3435. The buyer played out the 8-9 vector of the range on the daily timeframe, and now the initiative has shifted to the seller. The seller's targets are 3245 and 3201...
Hey traders and investors! The price has reached the lower boundary of the range. There is no volume spike. I expect a further decline toward 2184 and 2100. The 2100 level is a contextual area to look for buying patterns. As part of a correction, the price could potentially drop to 1800. Monitoring. This analysis is based on the Initiative Analysis concept...
Hey traders and investors! 📍 Context On the daily and 4H timeframes, the market is in a sideways range (Black lines = range boundaries). Buyer initiative is active on 4H. The target initiative is 108,952. However, on the daily timeframe, the seller initiative is in control, and a seller zone has formed. The seller zone is the red rectangle on the chart. 📊 Key...
Hey traders and investors! 📍 Context • Market phase: Sideways range • Current control: Seller initiative 📊 Key Price Action: The price broke above the upper boundary of the range (2738) with a buyer KC candle, touching the 50% retracement level (2874) of the last weekly seller initiative (1). However, the seller absorbed the buyer’s candle and pushed the price...
Hey traders and investors! 📍 Context On the monthly timeframe, the market was in a range. The price broke above the upper boundary and was long supported around the 101.080 level. This level was repeatedly tested by sellers and now appears to have been broken. 📊 Monthly targets: 89.20 and 88.300. 🔎 Analysis Why might the downward movement continue? Daily TF ...
Local range near top of broader sideways (gray lines = local range). Seller broke down from it. Price now in buyer zone — possible buyer reaction. Just below: a gap. Seller targets: 3271, 3245. Conservative shorts: watch for buyer activity + seller defending local range breakout (3333). Note: buyer initiative still active on daily TF (!). For longs, better to...


