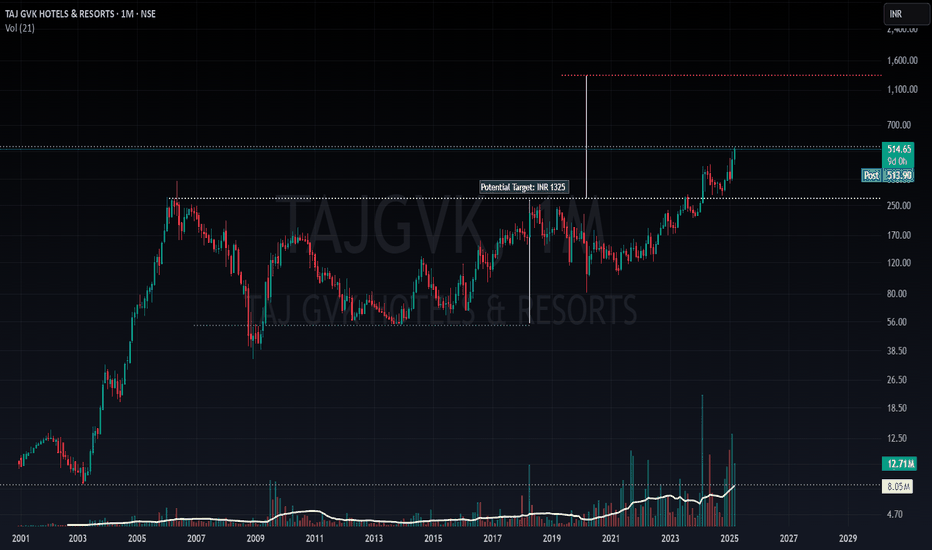
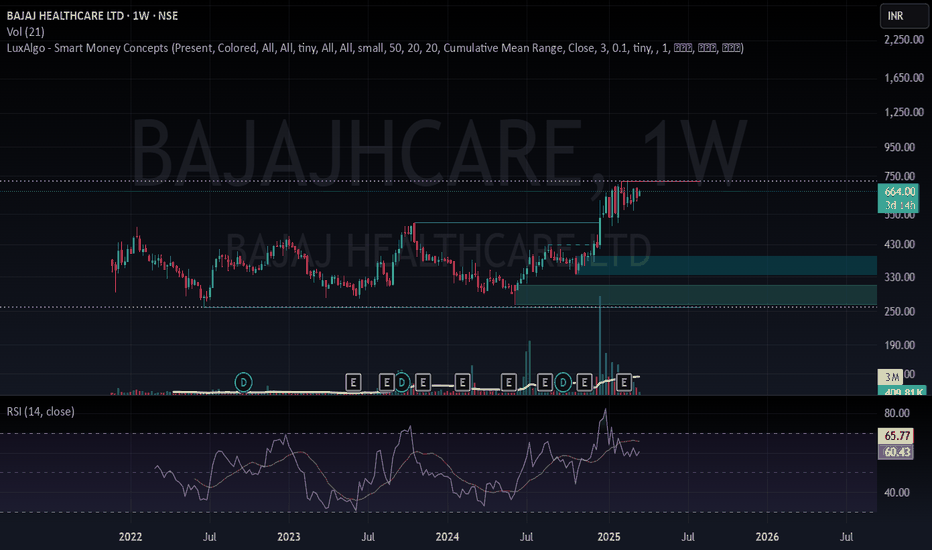
Technical Analysis The chart shows a clear inverted Head and Shoulders / ascending triangle pattern. The breakout above the neckline confirms the pattern, suggesting a potential upward move. The target price of INR 1325 is derived by measuring the height from the head to the neckline and projecting it upwards from the breakout point. Additionally, the stock is...
Fundamentals Perspective Revenue Growth: Bajaj Healthcare has shown a significant increase in revenue, with a 13.1% rise in Q3FY25 compared to the same period in FY24, reaching Rs 1,227.9 million. This growth indicates a strong operational performance. Profitability Improvement: The company reported a substantial increase in PAT (Profit After Tax) for Q3FY25,...
Hindustan Unilever has successfully validated a cup and handle pattern and is well on its way to 3600 levels, which would be the first obvious target. Stoploss levels would be 2400, although I would personally use ATR or Supertrend or 50DEMA as a trailing stoploss from here on. That said, please do follow appropriate risk management and position sizing principles.
IDFC First Bank is near its all time high and has show some strength when compared to other banking stocks. That said, it is at a crucial zone, and may go sideways or retrace a bit before breaking out of the ATH zone. But once it does, chances are it will gain strong momentum and keep going for some time as there is no obvious resistance zone! That is, it is...
Tata Consumer Products has created a double bottom pattern on a weekly timeframe and given a decent breakout on a daily timeframe, making it an ideal buy candidate. Being an FMCG sector stock in India, which has an ever increasing population, also a very young population, makes FMCG stocks a very safe bet for a few years. Add a decent setup from a technical...
ADSL has formed a cup and handle breakout on a weekly timeframe and is currently retesting the previous resistance zone. It seems like a good time to initiate a trade, as the stoploss would be relatively small, being just below the crucial zone which is now acting like a support. Although the target is relatively small as per the price pattern, it is best to use a...
Gold has been the go-to hedge against inflation and uncertain economic/political/social situations. But has it always given good returns? Not necessarily. There have been times when gold has been in a range or even in a downtrend for more than a decade. Eventually it might rise, sure, but will you be willing to wait for so long? Of what use is the profit if you...
Short term view - sideways to down trend Long term view - still bullish, as target of inverse head and shoulders on the weekly charts, which has been validated by a strong breakout is 22000 and has not reached yet.
Nifty seems to be taking a pullback after being in a nice uptrend since April. But this does not seem like a change in trend just yet, more like a temporary cooling down and I would certainly be waiting for a positive price action which would probably happen sometime next month.
Nifty rejected all-time high (ATH) levels. 2 possible outcomes: 1. Price closes above 19,880 to resume uptrend. 2. Price closes below 19,550 for retracement. I'd treat both as buying opportunities as overall trend is up.
I recently overheard a couple of guys discussing investments and stocks at the gym, and one of them told the other to buy "Yes Bank" as it is apparently at a good valuation right now. My take on it? Maybe. Maybe it is available at a so called "discount". But it had also gone down from 400 to 5. Almost 98.5% down from all time highs. Which means it has a lot of...
Ashok Leyland has created a cup and handle formation on weekly charts, which would be validated if price crosses 175 with good volumes. Keeping a stoploss of previous swing low, it can be a good postional trade setup. That said, it is always a great idea to trail your profits using moving averages or ATR or any trend following indicator.
Apollo Hospitals has given a breakout from a resistance zone which it has been respecting since over a year. Buying volumes on the breakout candle are not very strong but buying volumes before the breakout candle were very healthy. Personally, I would wait for the first retracement and use a tight stoploss along with 20EMA on weekly charts as a trailing stoploss.


