AnishBadwe
ONCT has reached a crucial level on the eve of earnings news. It might crash down if it can't hold above this level or it might climb to $8.2 if it can hold above this level. Earnings call on Thursday will fuel the move up or down. Position will be based on the next couple days.
The 200 EMA crossover has occurred again! This time we have positive expectations of earnings as well. A good recipe for gains. Keeping the analysis simple. Target price: 3.5+
Keeping the analysis simple, AVXL has crossed over its 200 period EMA whenever it has crossed its 200 EMA in the past it has shot up/down in the direction of the crossover.
Quite a few gold stocks are showing strength. All of them have seen- 1. A spike in volume 2. Greater price range for the day 3. New 3-month highs These indicate a bullish run from Gold stocks, possibly testing previous highs. Is the fact that gold is a safe haven in bearish markets causing this? Gold price going up, gold stocks going up.
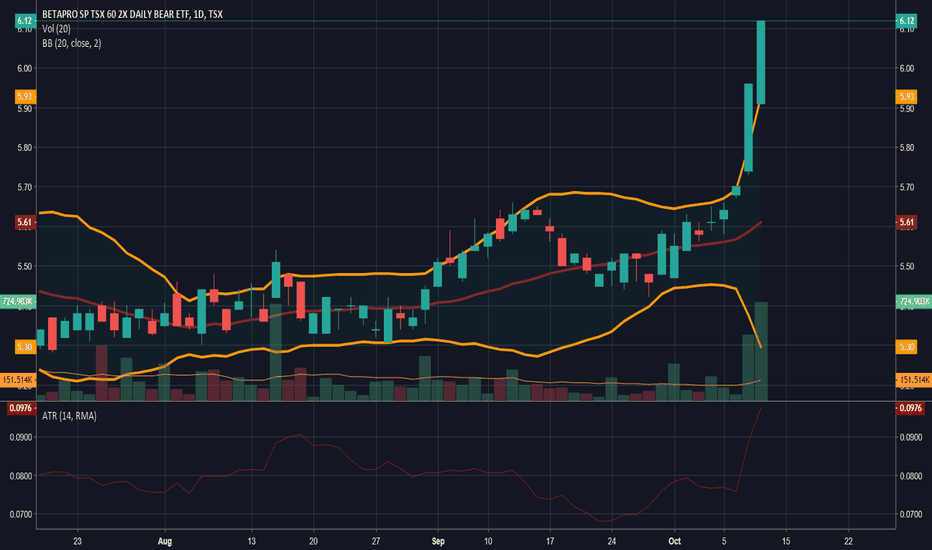
With stocks markets falling like crazy it may be time to hold more cash than equity. Inverse etfs might be a good hedging idea or a replacement to shorts. There have been big expansion the last two days. Volatility increase, range increase and strong green candles indicate a bearish tsx.
1. Daily chart shows "Three White Soldiers" or three bullish candles. Price is closed out quite well. Three such candles haven't been seen before at a low point in the downtrend. This suggests that this may be a significant low point. 2. Weekly chart show a bullish hammer followed by a week with a higher high and higher low. 3. On both time frames, bullish price...
Since April 19th we have seen a rapid fall in EURUSD. It has crossed below its 200 period (daily) Simple Moving Average which is an early sign of a downtrend. However, 1.15500 has been a resistance/support line for the pair since 2015. This level may be a first real test of the downtrend. Weekly Ease of Movement which is a function of Price and Volume has crossed...
1. Multiple bullish hammers indicating that bulls are winning at the end of the day. Today, bulls really took over with a big move up. 2. The bullish candles are at PAT's lower bollinger band as well. 3. A slow stochastic is turning up from its oversold zone and there is also a MACD crossover Trade aiming for 1.75 in the next few days.
GGI experienced a pullback in an up-trending market (Usually 3-4 days of pullback before its next move up). Try to buy in around 2.90. I am expecting GGI to reach a level of 3.40-3.55. Stop loss at 2.7 or approximately its trend line.
1. Bouncing of its Long Held Support. 2. Bullish Hammers at the lower bollinger band. Followed by higher lows the last two days. 3. Slow Stochastic is turning up for the oversold zone. These are signs of a reversal (at least a short-term reversal). Buy in at 2.25-2.26. Stop Loss at 2.14.
FIRE has dropped down to the $1.60-1.70 range a few time in the couple months only to bounce back. This is probably a support level for FIRE. Every time it hits its support level, a bullish candle is formed and it pushed towards $2+ in the next few days. Basically, FIRE is shown movement that has been bullish historically. The slow stochastic supports this...
A simple analysis of the uptrend shows the end of a pullback in the FCC uptrend. FCC bounces back at 1.06-1.07. I see the next move up being up to 1.28-1.30.
The bullish hammers of the last few days indicate a trend reversal in TSXV:EMC. Stochastic has been slowly climbing out of the oversold zone and it may just be the right time to buy in. I am hoping to buy in around 1.44-1.45, and I will place a stop one ATR below at 1.31-1.32 which is below their 52week low (hopefully it holds).
We see a potential reversal in TSX:NEPT indicated by a bullish hammer at its lower bollinger band AND also at a long held support level! I see TSX:NEPT working its way up to its resistance level at least. Hopefully it can break through the trading range. TSX:NEPT can be a very volatile stock as indicated by the Average True Range, so buy in very carefully.
1. Bullish hammer at the lower bollinger band followed by lower lows. 2. Stochastic is turning from an oversold position This could turn out to be a big reversal for CS, I can see a move as big 20%. If not that big, CS will be gaining a bit in the next few days at least.
1. Bullish hammer at lower bollinger band on 02/02/2018 2. Higher lows the following days. 3. Price closed strongly on 04/02/2018 4. Stochastic turning upwards from a near oversold zone I identify this as a reversal point for RTI. I expect it to at least reach $1.7 in the next few days possibly climb up to $1.85-2 level by next week.
On Friday at 13:40 EST UKOIL bounced off of $61.80 and worked itself up a bit. At 13:40 EST USDCAD reversed as well. A bearish hammer was formed at the upper bollinger band. Short if and only if: 1. UKOIL opens higher 2. Slow stochastic turns down from the overbought zone Short position will be strictly short-term and dependent on the performance of UKOIL.
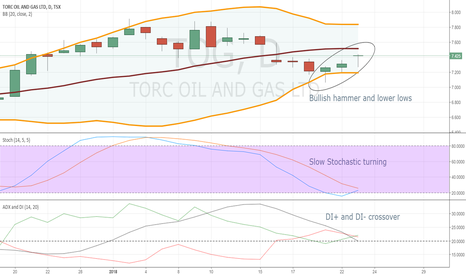
We see bullish hammers and stochastic turning from its oversold zone. The DI+ and DI- crossover tells us that the market might trend upwards in the short term!


