AnthonyAaron
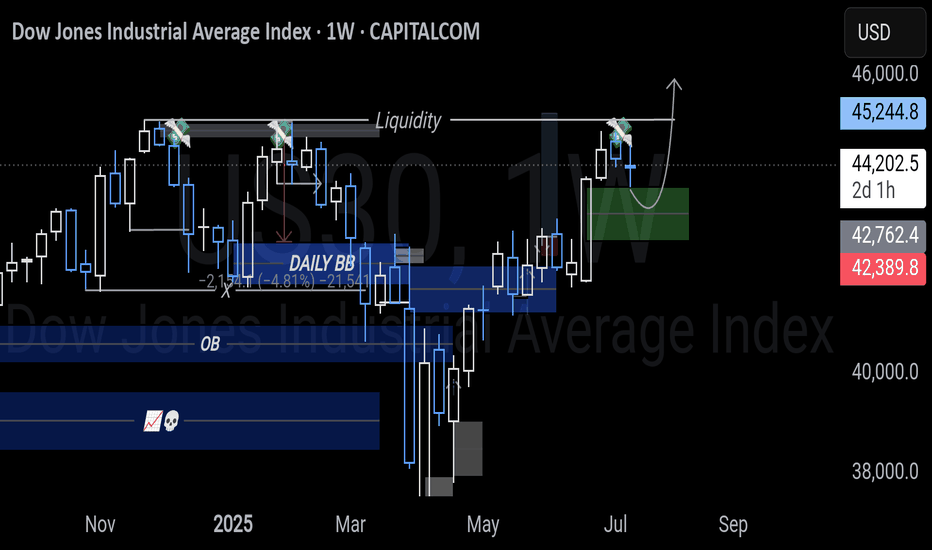
Triple tops are the next liquidity targets from a fvg support as shown. the tops are week as we have seen NASDAQ and S&P500 hav3 liquidated their highs its. Lear US30 is following the same path.
Price is reacting from a weekly FVG just below the 50% of a larger range, with some bullish momentum possibly fueled by recent geopolitical tensions. But price is still within a bearish range acting as resistance, so upside may remain limited unless structure shifts. A daily bullish OB below the 50% of that range could offer a solid pullback entry if price...
USDHKD skyrocketed 1.2% as I mapped it out though I didn't expect move that fast it did respect the peg range. Now what's next? Definitely total consolidation haha
March setup played out textbook -3.5% drop straight from the overlapping fvg/imbalances into the weekly order block. Now price has reacted back with a clean 7% push right from the zone I mapped months ago. Price is deep in premium sitting at weekly supply, distribution might be cooking or bulls could just be catching breath. Either way structure’s in control not emotions
USDHKD is waking up and we're getting early signals of a run toward 7.85 This pair moves in slow motion, but right now the setup is clear as price is grinding higher after bouncing perfectly from our key level. HKMA’s 7.85 weak-side peg is acting like a price magnet when the Fed stays hawkish = fuel for this move Most traders ignore this pair because it’s pegged...
After liquidating an alltime low back in 2023 GBPUSD has been strongly bullish thought the whole years and before you is a bullish continuation analysis. I'm expecting price to react from the unmitigated orderblocks for continuation. It's quite self explanatory with the path arrow. I'm expecting new highs this year
Price retracted to the 30min highlighted sell zones and give a 1:9 RR.
SP500 liquidated all-time high and is now expected to return into the range. On the 4H timeframe I've identified a potential bullish zone for a possible pullback while the 30-minute chart highlights a bearish zones where sellers might step in. These levels will guide the next move depending on how price reacts.
Price dropped from the daily OB as anticipated prior and now for bullish orders it will be Eise to looke for bullish confirmations on the daily orderblocks i have plotted.
Beautiful short idea 60 pips sl. Targeting the lows over the curve,.FVG, BB and the next bullish order block.
Price is still bullish as sellers are strong on the highlighted bearish orderblocks. I advice looking for buying opportunities on the lower time-frames as price shows it's still bullish until the bearish orderblocks where we will still have to look for bearish confirmations to sell GBPJPY.
Let's engage in this short trade Targeting the lows.
US100 did move as expected except it hit our stop loss level on the long Position before reversing and activating the short position. Right now the short position is looking good for those who want to close partials or moving the stop loss to break even fell free to do so.
This a clear price view to the recet post I realized the orientation wasn't suitable.
Lrice is strongly bullish so I think the highs 87.7 and 94.9 will be the mitigated next so looking for long opportunities is very valid on lower time-frames.
This is the area of interest that can be used as an entry zone for long orders that's based on the narrative we buit in the previous post.
That's where we will be looking for selling setups. On the other hand we can have long positions targeting the highs on the way to the order blocks. I'm going to share that shortly
Here is nother selling opportunity. Let's see how this one plays out it's quite late and already active but it's still in a low risk zone for sells


